
Figure 2.
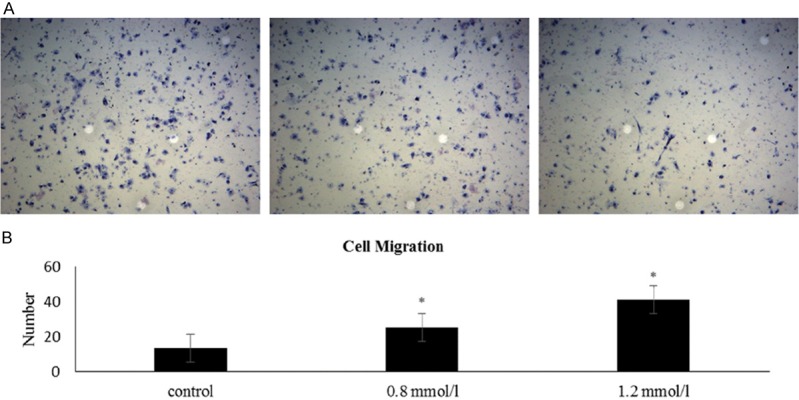
UDCA inhibits the migration of 7721. A. The control group without UDCA (left). The group treated with 0.8 mmol/l UDCA (middle). The group treated with 1.2 mmol/l UDCA (right). B. Histogram of cell migration. All results are expressed as the mean ± S.D. from three independent experiments. *P<0.05 indicates a statistically significant difference compared with the control group.