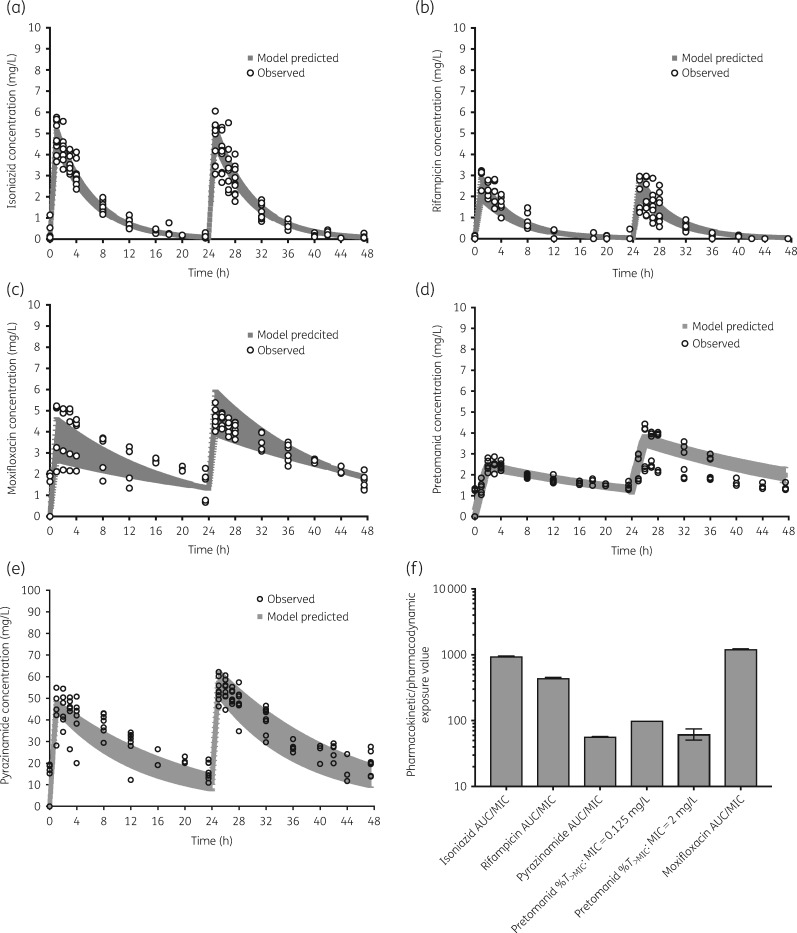
Figure 1.
Concentration–time profiles of the drugs. (a–e) Pharmacokinetic model-derived concentration–time profiles based on drug concentrations measured in the HFS-TB. Open symbols are observed concentrations and shaded areas are 95% confidence bounds. (f) Pharmacokinetic/pharmacodynamic exposure achieved for each drug with errors bars that are 95% credible intervals. Error bars are very narrow for each drug, except for pretomanid (%T>MIC: MIC=2 mg/L), which shows modest error bars.

