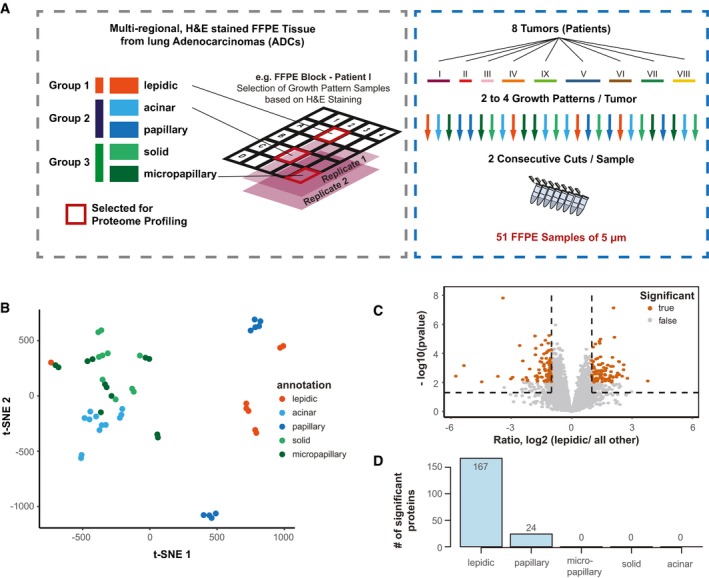
Figure 4. Proteome analysis of tumor growth patterns in pulmonary adenocarcinoma (ADC) FFPE tissue.

- Schematic illustration of the sample collection. Samples were collected from eight different patient tumors. For each tumor, sections were processed with hematoxylin and eosin (H&E) staining to locate different growth patterns of lepidic (low grade; group 1), acinar and papillary (intermediate grade; group 3), and solid and micropapillary (high grade; group 3). Two to four growth patterns per tumor were selected and sectioned into two consecutive 5 μm iterations, to provide replicates with highest possible similarity, resulting in a total of 51 samples (one iteration was missing).
- t‐Distributed stochastic neighbor embedding (t‐SNE) analysis of the proteome data corrected via a linear regression model. The different growth patterns are color‐coded as in panel A.
- Volcano plot showing differential expression analysis using Limma‐moderated t‐statistics for the comparison of lepidic samples against all other samples. Proteins passing significance thresholds of −log10 P < 0.05 (Benjamini–Hochberg adjusted) and an absolute log2 fold change of > 1 are highlighted in orange.
- Summary of significantly expressed proteins in the comparison of each growth indicated pattern against all others.
Source data are available online for this figure.
