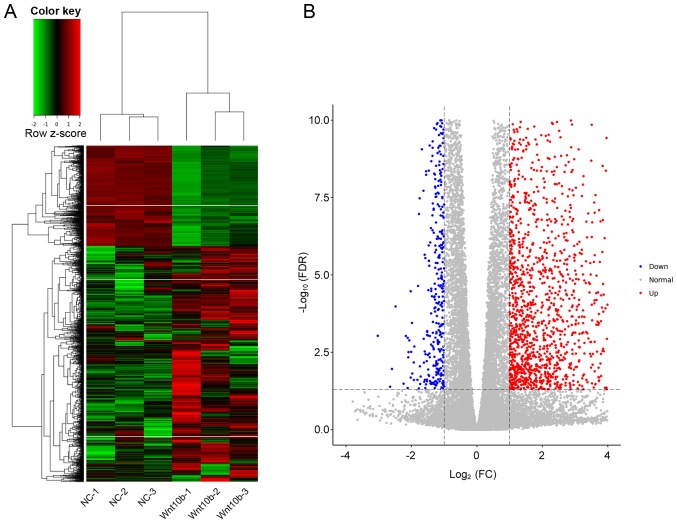
Figure 1.
Gene expression in WNT10B-treated and control DPCs. (A) The heat map displays gene expression changes in the 3 WNT10B-treated and 3 control DPCs samples. Red, black, and green represent increased, unchanged, and decreases expression, respectively. (B) Volcano plot of upregulated and downregulated differentially expressed genes between WNT10B-treated and control DPCs. WNT10B, Wnt family member 10B; DPCs, dermal papilla cells; FC, fold-change; FDR, false discovery rate; NC, negative control.

