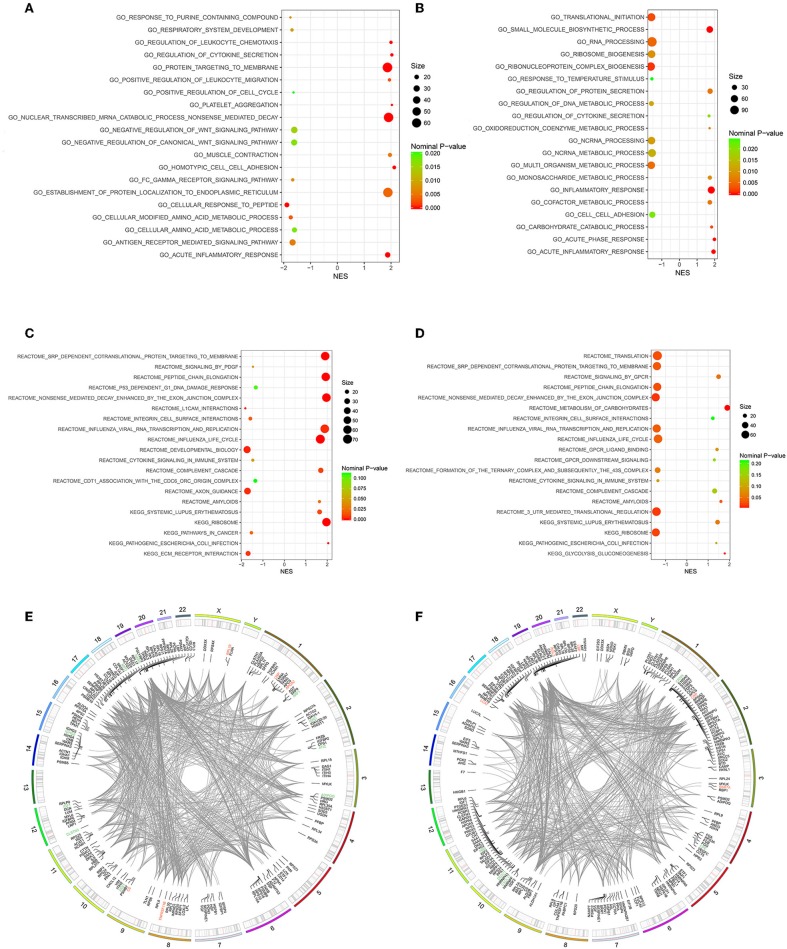
Figure 6.
Gene Set Enrichment Analysis (GSEA)-Gene Ontology enrichment of follicular fluid from PCOS patients and controls. (A) Top10 upregulated and downregulated biological processes of Po vs. Control. (B) Top 10 upregulated and downregulated biological processes of Pn vs. Control. (C) Top10 upregulated and downregulated KEGG or Reactome pathways of Po vs. Control. (D) Top10 upregulated and downregulated KEGG or Reactome pathways of Pn vs. Control. (E,F) RCircos and GSEA-STRING analysis indicating chromosomal localization, heatmaps of protein expression, and interactions of proteins within the leading edge gene sets of top enriched biological processes in Po vs. Control and Pn vs. Control, respectively. Upregulated DEPs were shown in red color, and the downregulated DEPs were shown in green.

