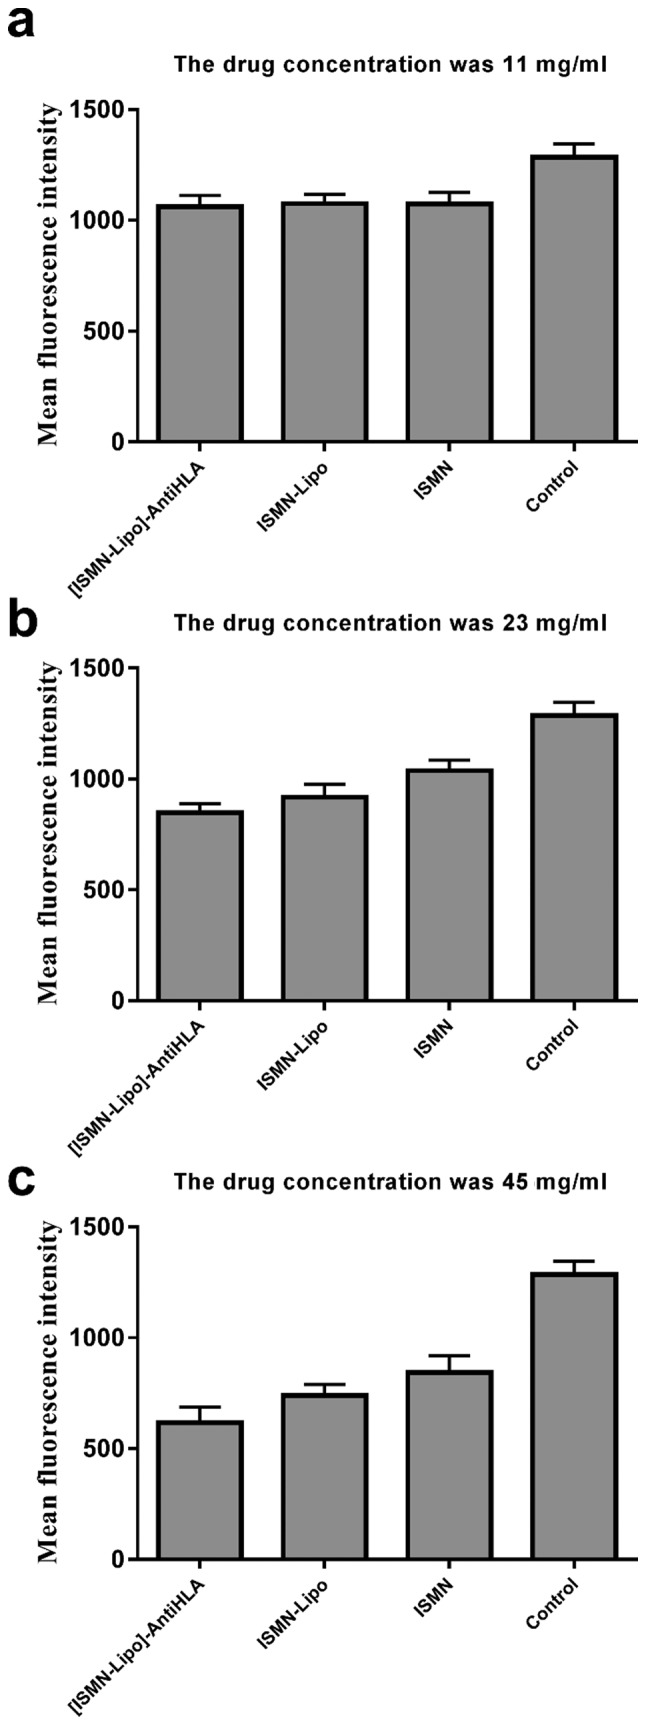
Figure 4.

Mean green fluorescence intensity following intervention with different concentrations of ISMN immunoliposomes, ISMN liposomes, and ISMN. SYTO9 and PI interacted with live (green) and dead bacteria (red), respectively. The x-axis represents the different interventions and the y-axis represents the mean green fluorescence intensity. (a) Drug concentration, 11 mg/ml; (b) drug concentration, 23 mg/ml; and (c) drug concentration 45 mg/ml. ISMN, isosorbide mononitrate.
