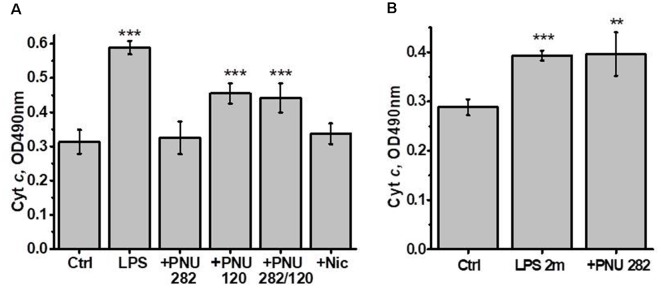
Figure 4.
Cyt c released from the brain mitochondria of mice treated with LPS ± PNU282, PNU120, their combination, or nicotine (groups 1–7, A) or LPS (2 months) ± PNU282 (groups 1, 8–9, B) under the effect of 0.9 μM Ca2+. Each column corresponds to Mean ± SD; **p < 0.005; ***p < 0.0005 compared to Ctrl; n = 5. The column +PNU282 in (A) combines data obtained for groups 3 and 4 (PNU282 given either simultaneously with or 7 days after LPS).

