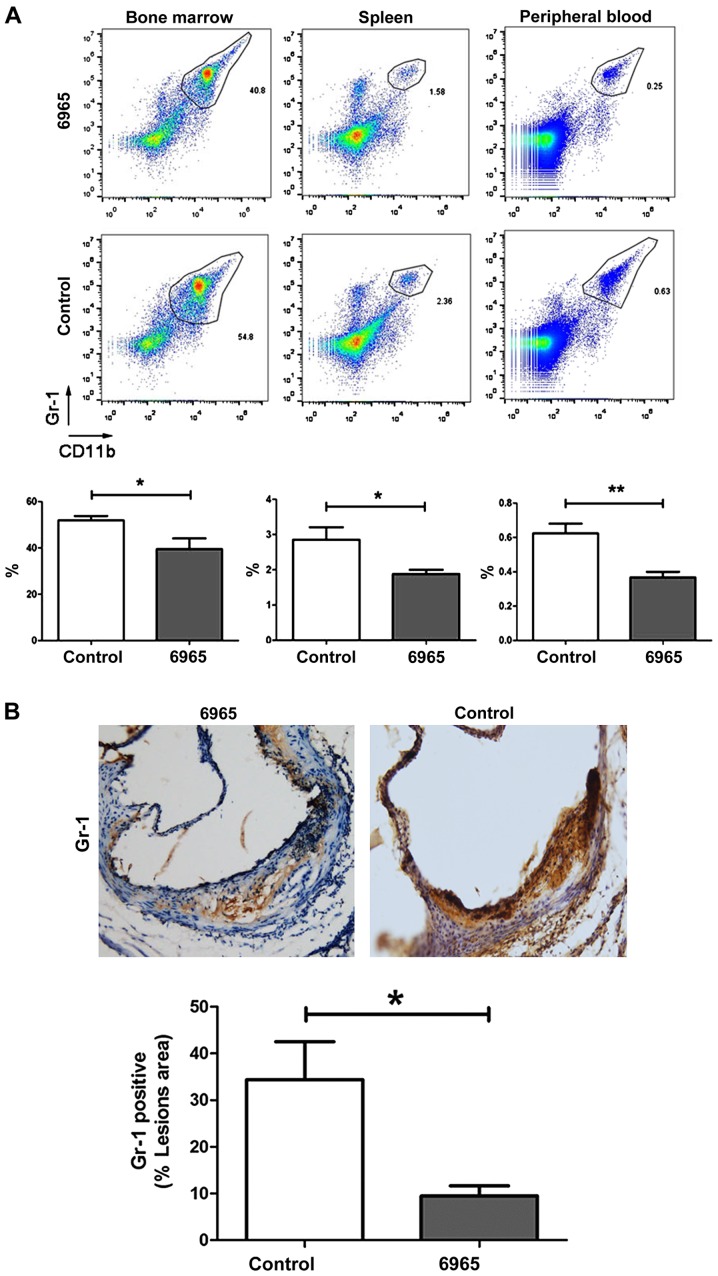
Figure 3.
Treatment with 6965 decreases the levels of MDSCs. (A) Flow cytometry and fluorescent staining were used to evaluate the proportions of CD11b+ Gr-1+ MDSCs. Representative images of the bone marrow, spleen and peripheral blood from different groups are shown. Data are presented as the mean ± SD. *P<0.05 and **P<0.01. (B) The expression of Gr-1 in plaques was analyzed by immunohistochemistry and the percentage of Gr-1 positive area was calculated in the total lesioned area (magnification, ×40). Data are shown as the mean ± SD. *P<0.05 vs. the control. SD, standard deviation; CD, cluster of differentiation; MDSCs, myeloid-derived suppressor cells.

