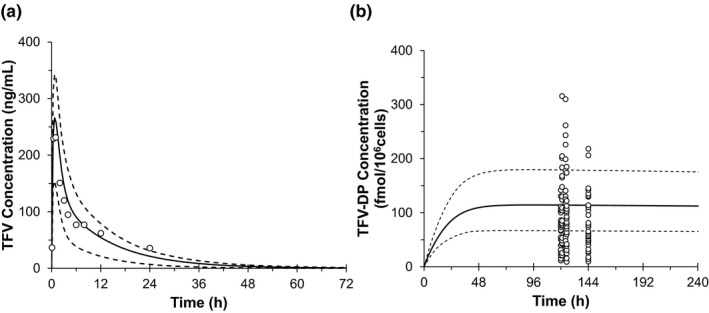
Figure 2.

Concentration‐time profile of single oral dose 300 mg tenofovir disoproxil fumarate predicted by physiologically‐based pharmacokinetic model in the plasma—tenofovir (TFV) (a) and peripheral blood mononuclear cells—tenofovir di‐phosphate (TFV‐DP) (b) overlaid by clinical observed data (Liu et al. 21). The black open circles represent the observed data. Black solid lines represent the predicted and black dash lines show the predicted 5th and 95th confidence intervals. h, hour.
