Figure 8.
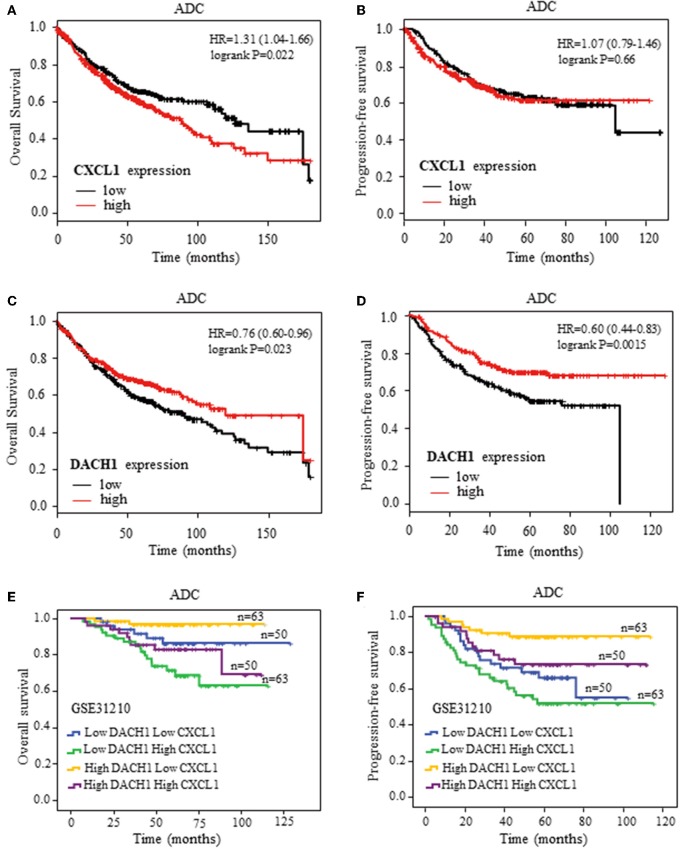
Kaplan–Meier survival curves. Survival curves of CXCL1 with OS (A) and PFS (B) for patients with ADC. Survival curves of DACH1 with OS (C) and PFS (D) for patients with ADC. The blend Kaplan–Meier survival curves of CXCL1 and DACH1 with OS (E) and PFS (F) for patients with ADC in GSE31210.

