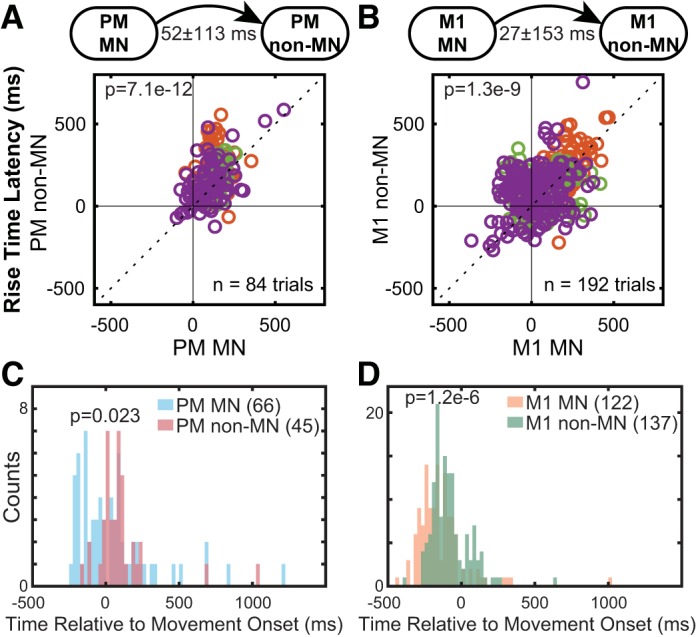
Fig. 3.

Comparisons of hidden state rise-time latencies and modulation onset times between mirror neurons (MNs) and non-MNs in premotor (PM) and primary motor cortex (M1). Scatterplots show hidden state rise-time latencies in PM MN vs. PM non-MN populations (A) and in M1 MN vs. M1 non-MN populations (B). A diagonal dotted line of unity slope in each plot divides transitions that occurred earlier in the former population (points above and left) from transitions that occurred earlier in the latter population (points below and right). Colored traces represent reaction (red), movement (green), and final (blue) state transitions. Modulation onset time histograms compare PM MN (blue) vs. non-MN (red) populations (C) and M1 MN (orange) vs. M1 non-MN (green) populations (D), demonstrating that individual MN onset times preceded those of non-MNs. Only trials in which the hidden Markov models detected 4 hidden states were used for computing these onset time distributions. Numbers of neurons in which onset times were detected are displayed in plot insets. Distributions were compared using Wilcoxon rank sum test. All P values were significant after Bonferroni correction for 2 comparisons.
