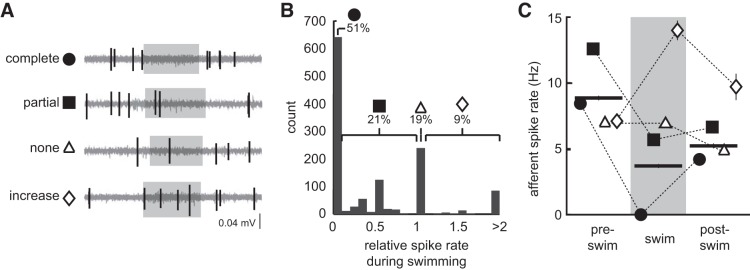
Fig. 3.
Quantification of spontaneous afferent spike rate during fictive swimming. A: example from a representative individual illustrating different levels of spontaneous afferent activity during swimming: complete decrease (●), partial decrease (■), no change (△), and an increase (◇) in afferent spike rate. Note that spontaneous spike rate was determined to be able to assess these definitions (see methods). B: histogram of spike rates during swimming relative to pre-swim spike rate, showing that over half of the trials consisted of completely inhibited afferent activity. C: afferent spike rates during pre-swim, swim, and post-swim (horizontal bars) during instances of complete decrease, partial decrease, no change, and increased spike rates. Error bars are ±SE.

