Fig. 7.

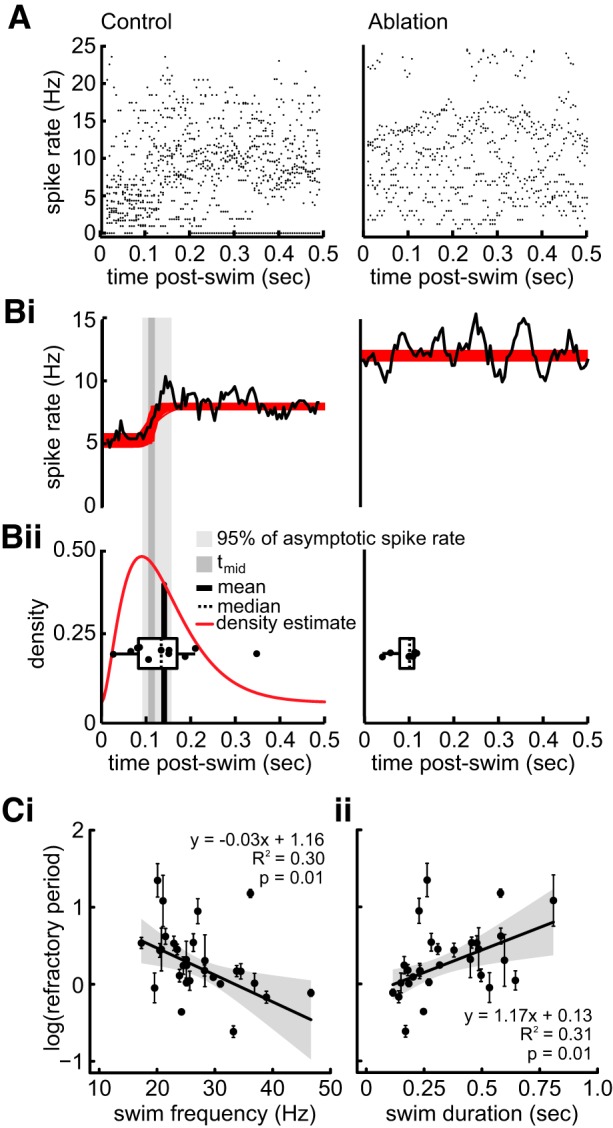
Spontaneous afferent spike rate remains suppressed after the offset of swimming. A: raster plot of the instantaneous afferent spike rates within a 0.5-s window after the swim in both control (left) and ablation (right) larvae. Bi: boot-strap simulation of spike rate (red line) and average spike rate (black line) reveal reduced afferent activity during the refractory period and a gradual return to intrinsic spontaneous spike rates in control treatments and relatively consistent spike rates after the swim in ablation treatments. Bii: boxplot of median refractory period (dashed line) for each individual overlaid atop the density estimate (red line) of the refractory period and the mean of the estimates (black bar). Both median and mean refractory periods are within the 95% confidence interval of the asymptotic spike rate for control treatments. There was no asymptote detected in ablation treatments. tmid, Midpoint of the best-fit equation. C: linear regression between refractory period and swim frequency (i) and swim duration (ii). Each point represents the mean (±SE) value for an individual.
