Fig. 3.
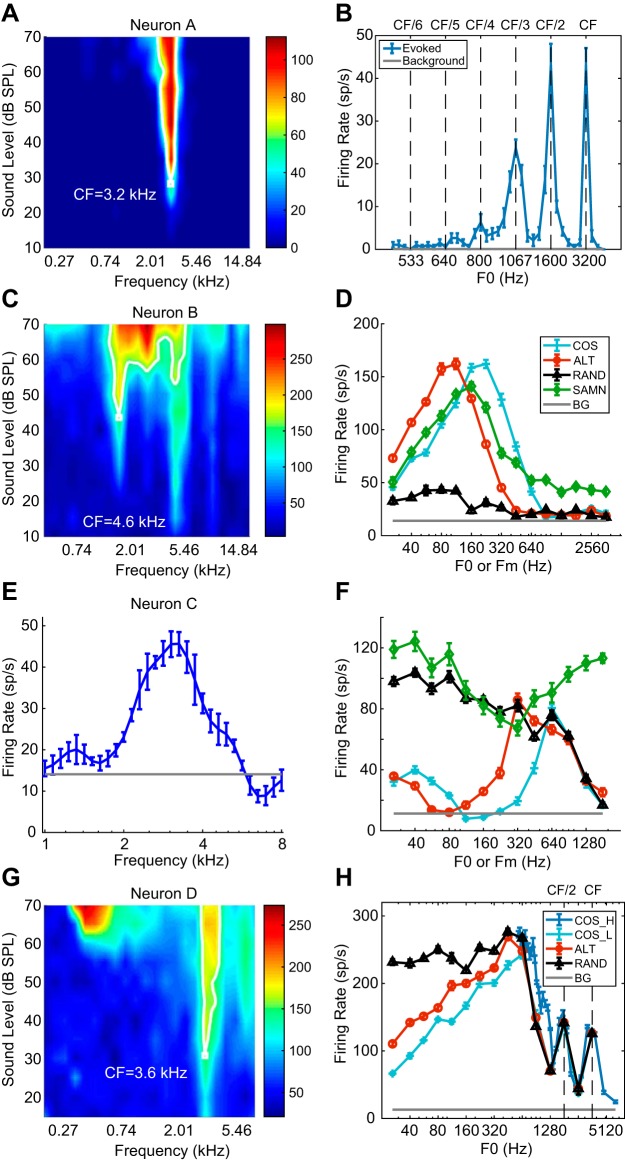
Pure-tone and complex-tone responses of 4 example neurons. A: frequency response area (FRA) of neuron A. The neuron is sharply tuned at 3.2 kHz. CF, characteristic frequency. B: rate-fundamental frequency (F0) profile of neuron A for all harmonics in cosine phase (COS) harmonic complex tone (HCT). Error bars represent ±1 SE. C: FRA of neuron B. The neuron has a complex response area, best frequency (BF) = 1.6 kHz. D: rate profiles of neuron B for HCT and sinusoidally modulated noise (SAMN). ALT, even harmonics in cosine phase and odd harmonics in sine phase; BG, background; Fm, modulation frequency; RAND, phase of each harmonic randomized for each neuron. E: isolevel tuning curve of neuron C measured at 40 dB SPL. BF = 3,062 Hz. F: rate-F0 profile of neuron C. G: FRA of neuron D. BF = 3.6 kHz. H: rate-F0 profiles of neuron D in response to complex tone with different phase configurations (COS_L, ALT, RAND) and COS phase at a different range of F0 (COS_H) designed to densely sample the region of resolved harmonics.

