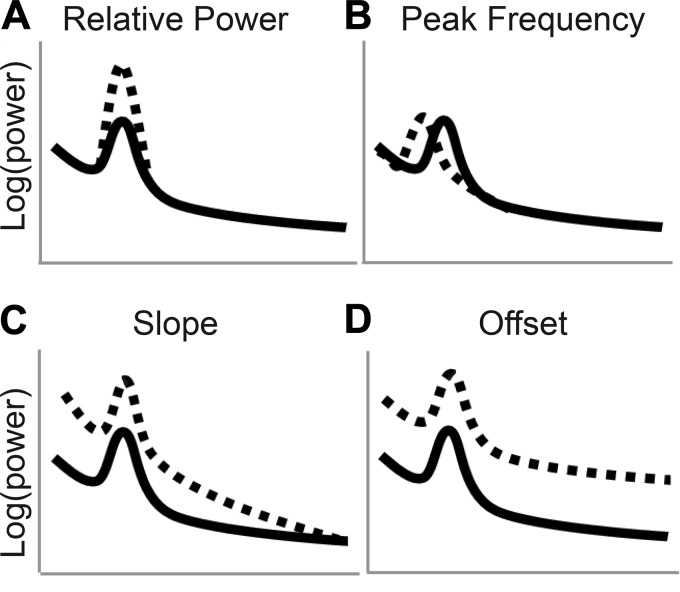
Fig. 1.
Schematic of the 4 components of the electrophysiological power spectrum. A: low (solid line) and high (dashed line) power in the alpha range. B: low (dashed line) and high (solid line) peak alpha frequency. C: flat (solid line) and steep (dashed line) slopes. D: low (solid line) and high (dashed line) offsets.

