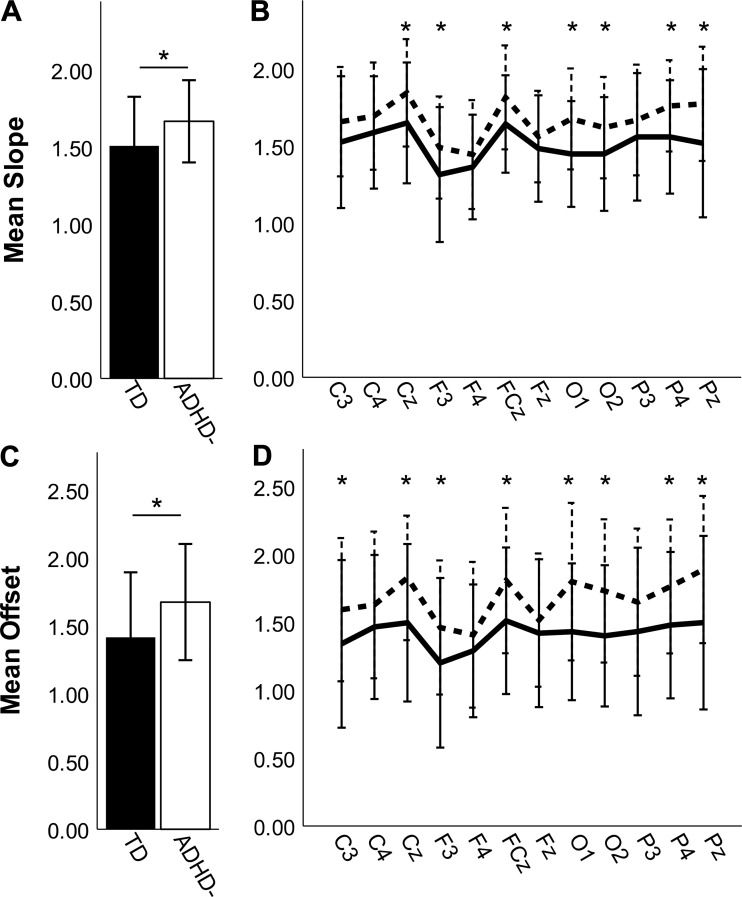
Fig. 2.
Comparisons of slope (A and B) and offset (C and D) in the full sample of typically developing (TD; closed bars, solid lines) and medication-naive attention-deficit/hyperactivity disorder (ADHD−; open bars, dashed lines) participants. Error bars are ±SD. A: ADHD− has steeper slopes compared with TD when averaged across participants and electrodes. B: slopes were steeper in ADHD− for all electrodes tested. C: ADHD− has greater offset compared with TD when averaged across participants and electrodes. D: this pattern holds when electrodes are considered individually. *P < 0.05, statistical significance after false discovery rate correction.

