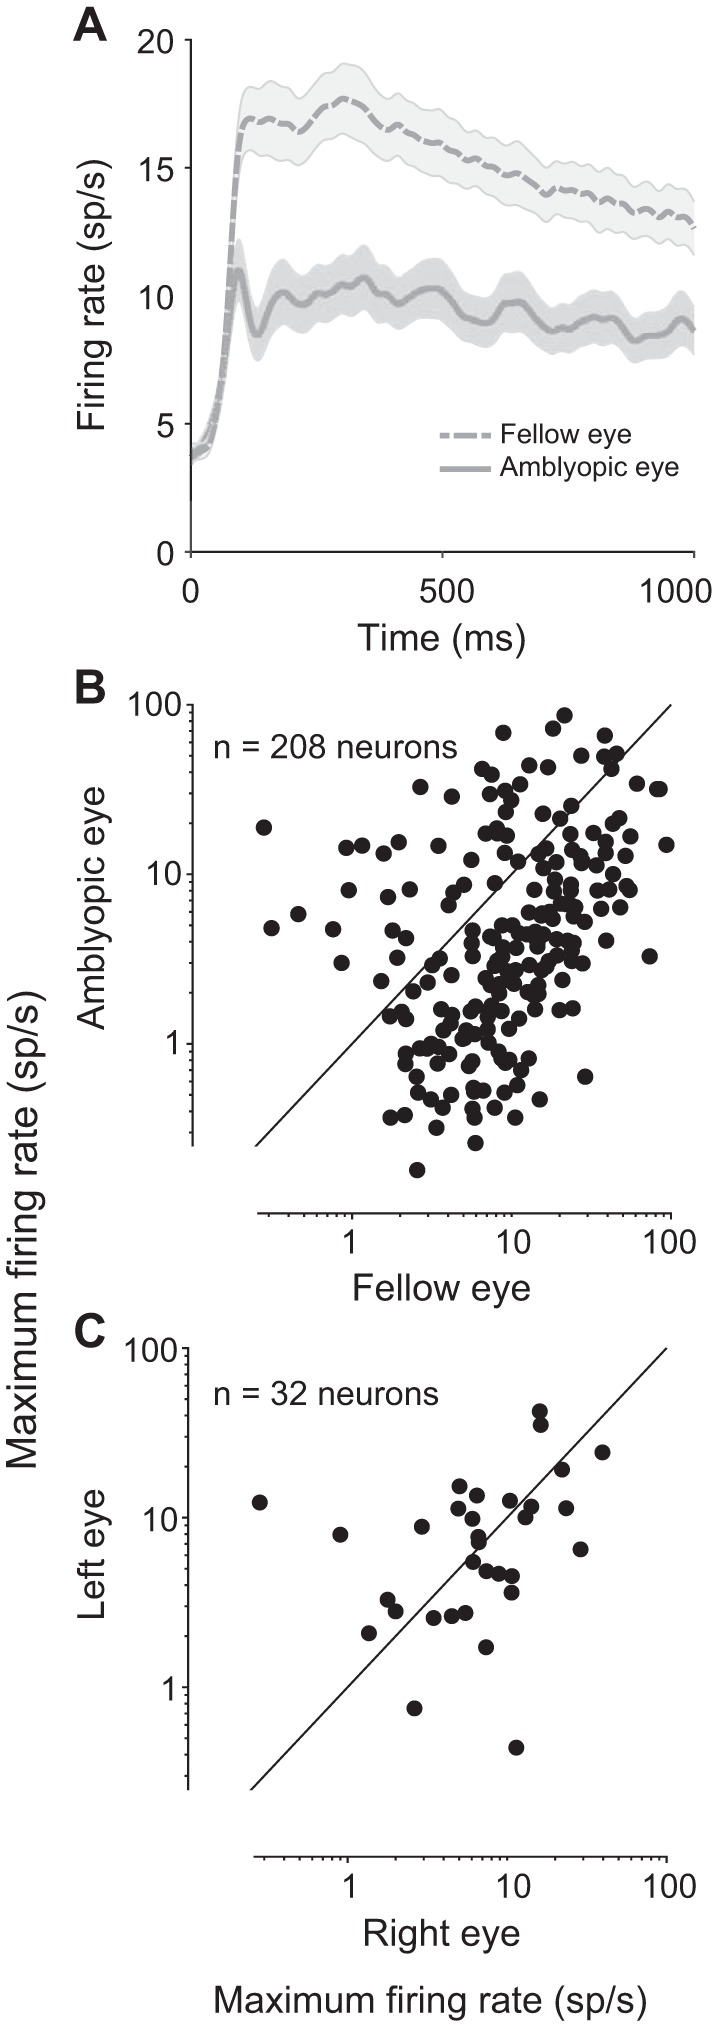
Fig. 2.

Comparison of neuronal firing rates in response to normal and amblyopic eye stimulation. A: peristimulus time histograms (PSTHs) show the population average responses to fellow and amblyopic eye stimulation. For each neuron, we computed a PSTH for the 1 stimulus orientation that evoked the highest response from that neuron and then we averaged across all recorded neurons. Shading represents ±1 SE (n = 208 neurons). Neuronal firing rates were greatly diminished upon amblyopic eye stimulation. B: each point in the scatter diagram represents the maximum firing rate (spike count during 1 s of stimulus presentation) of each recorded neuron across 12 tested orientations of drifting gratings. The maximum firing rates in response to stimulation of the fellow eye are plotted against the maximum firing rates evoked by amblyopic eye stimulation. The majority of recorded neurons showed decreased responsivity to amblyopic eye stimulation compared with fellow eye stimulation. Combined across animals, a total of 208 neurons were recorded from primary visual cortex of amblyopic animals. C: same as in B except that data for the control animal are shown. A total of 32 neurons were recorded in the control, visually normal animal. There was no observed difference in the maximum firing rates elicited by stimulation of normal right and left eyes.
