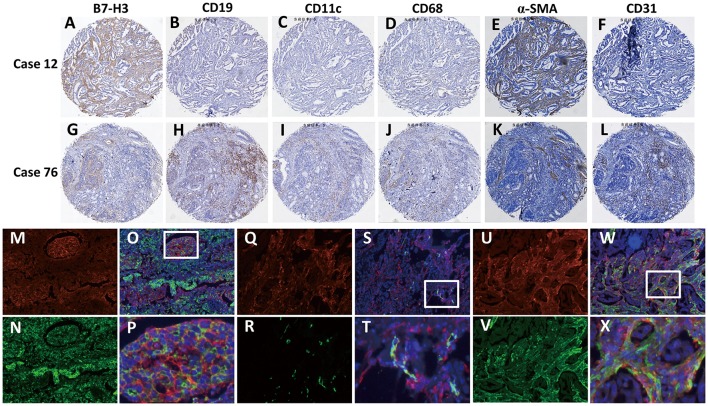
Figure 2.
Identification of B7-H3-positive cells in gastric adenocarcinoma tissues. (A–F) A tumor with high B7-H3 expression in stromal cells and its CD19, CD11c, CD68, CD31, and α-SMA expression status. (G–L) A tumor with high B7-H3 expression in tumor cells and its CD19, CD11c, CD68, CD31, and α-SMA expression status. (M–X) Double immunofluorescence analysis of B7-H3 and PanCK, CD31, or α-SMA in gastric adenocarcinoma tissues. DAPI fluorescence is shown in blue, B7-H3 immunofluorescence is shown in red, and PanCK, CD31, or α-SMA immunofluorescence is shown in green; (M,N) B7-H3 and PanCK immunofluorescent staining; (O) the merge picture of B7-H3 and PanCK with DAPI immunofluorescent staining (×100 magnification); (P) magnification of the dotted line frames of (O) (×400 magnification); (Q,R) B7-H3 and CD31 immunofluorescent staining; (S) the merge picture of B7-H3 and CD31 with DAPI immunofluorescent staining (×100 magnification); (T) magnification of the dotted line frames of (S) (×400 magnification); (U,V) B7-H3 and α-SMA immunofluorescent staining; (W) the merge picture of B7-H3 andα-SMA with DAPI immunofluorescent staining (×100 magnification); (X) magnification of the dotted line frames of (W) (×400 magnification).

