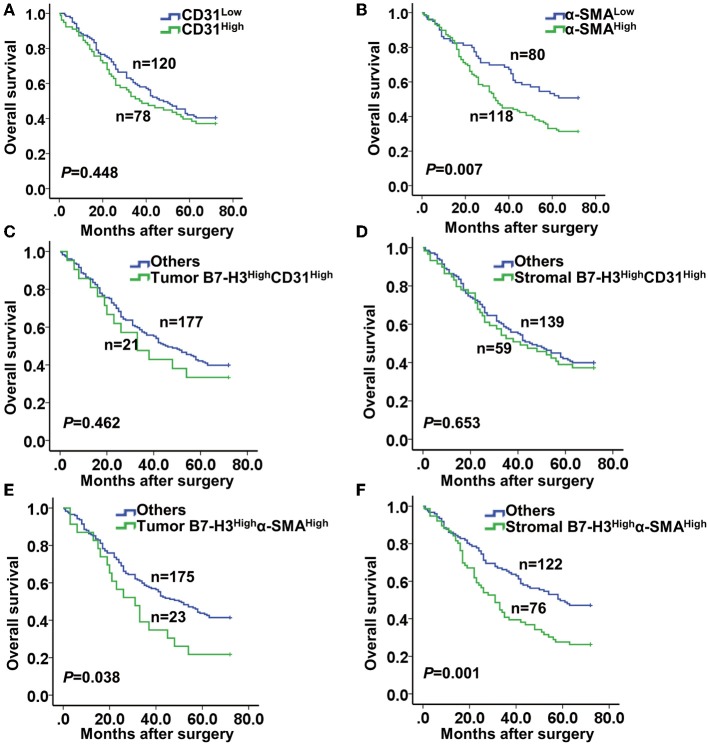
Figure 4.
Kaplan-Meier curve of survival according to the expression of CD31, α-SMA, and B7-H3. (A) Kaplan-Meier curves according to low and high expression of CD31 (CD31low and CD31High). (B) Kaplan-Meier curves according to low and high expression of α-SMA (α-SMAlow and α-SMAHigh). (C,D) Kaplan-Meier curves according to the combination of expression of B7-H3 and CD31: (C) B7-H3High CD31High vs. others (including B7-H3High CD31Low, B7-H3Low CD31High, and B7-H3Low CD31Low) in tumor cells; (D) B7-H3High CD31High vs. others in stromal cells. (E,F) Kaplan-Meier curves according to the combination of expression of B7-H3 and α-SMA: (E) B7-H3High α-SMAHigh vs. others (including B7-H3High α-SMALow, B7-H3Low α-SMAHigh and B7-H3Low α-SMALow) in tumor cells; (F) B7-H3High α-SMAHigh vs. others in stromal cells.

