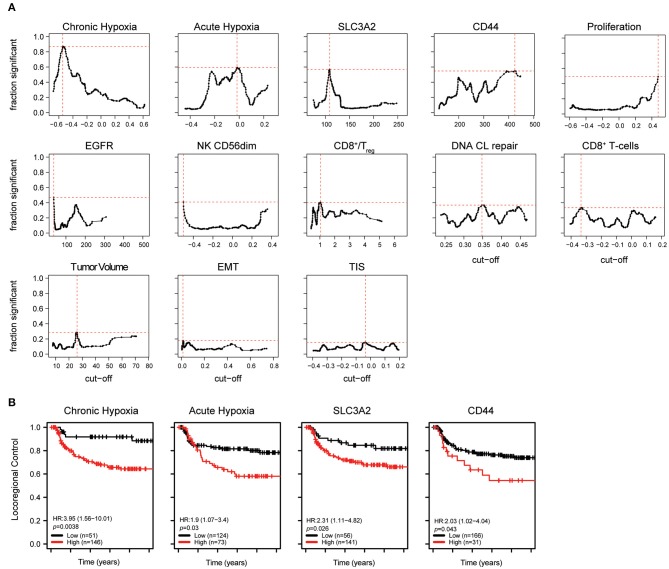
Figure 2.
Role of individual biological factors for locoregional control. (A) Results of individual bootstrap analysis (see methods) including important clinical factors. The fraction of randomized cohorts with a significant association with locoregional control is shown for each cut-off and biological marker. Markers are ordered by the magnitude of the maximum fraction of significant Cox proportional hazard tests at the best cut-off. The best cutoff is indicated with dotted red lines. (B) For each marker, the cohort was split into a high and low group at the best cutoff determined in A. Hazard ratios for recurrences and corresponding p-values were obtained with a multivariate Cox proportional hazard analysis using the same variables as those used to determine the cutoff.

