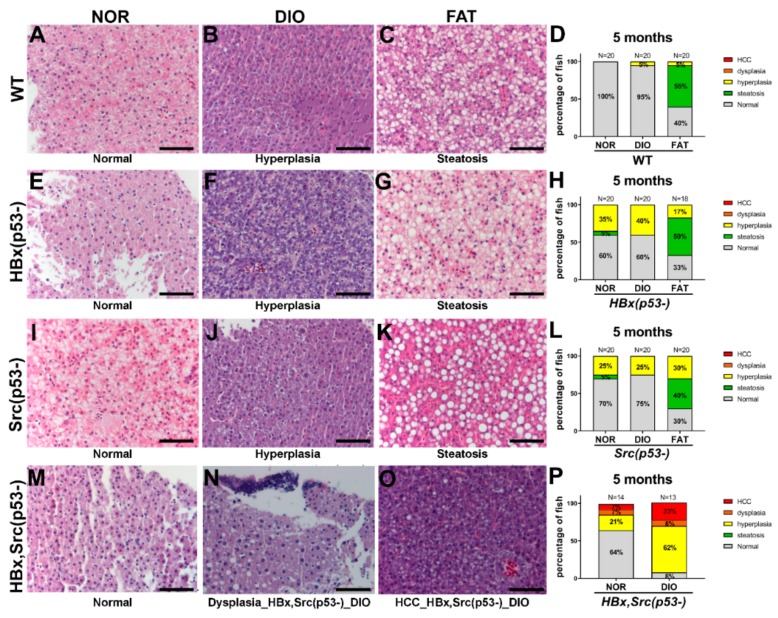
Figure 3.
Histopathological changes in various genetic background zebrafish fed with different diets. Representative H&E stain images and histopathologic change statistics of (A–D) WT, (E–H) HBx(p53-), (I–L) Src(p53-), and (M–P) HBx, Src(p53-) fish after 8 weeks of normal diet (NOR), overfeeding (diet-induced obesity, DIO), or high-fat diet (FAT) starting at 3 months of age, and scarified at 5 months. The histopathologic change consists of percentages in five states: normal, steatosis, hyperplasia, dysplasia, and hepatocellular carcinoma (HCC). The number of fish is represented as N on top of each bar. The scale bar is 50 μm.

