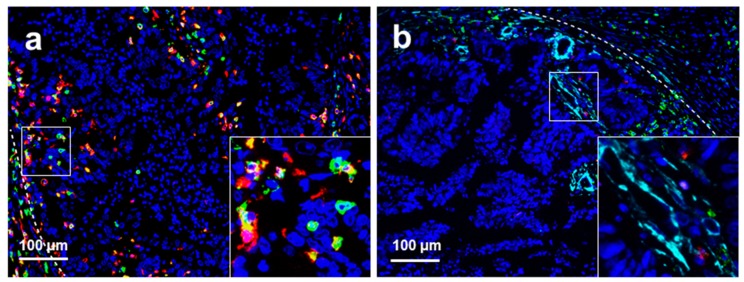
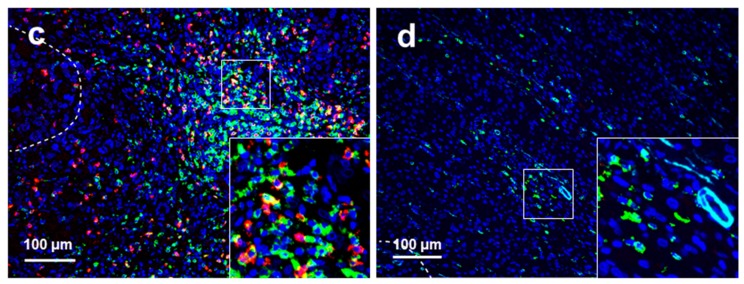
Figure 4.
Representative immunohistochemical multiplex images of different CD3/CD8 ratios of T cells in liver metastasis of colorectal cancer. (a) High CD8/CD3 ratio in the intratumoural regions of liver metastases; (b) low CD8/CD3 ratio in the intratumoural regions of liver metastases; (c) high CD8/CD3 ratio in the peritumoural regions of liver metastases; and (d) low CD8/CD3 ratio in the peritumoural regions of liver metastases. Nuclei (DAPI, blue), CD3 (membrane, fluorophore 520, green), and CD8 (membrane, fluorophore 690, red). The white dotted lines represent the borders of liver metastases and normal liver tissue. All scale bars equal 100 μm.


