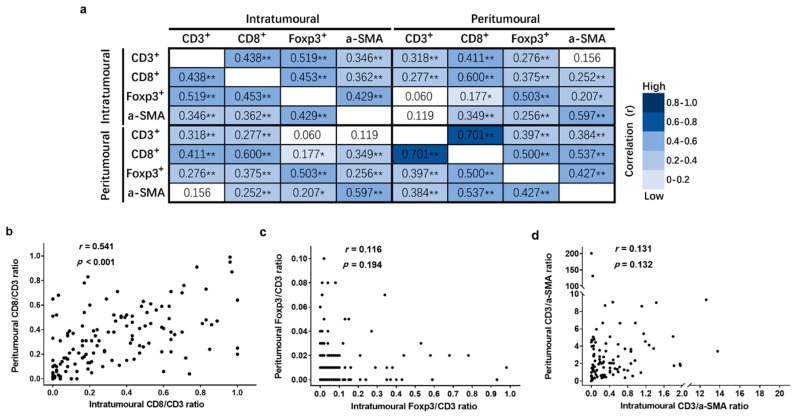
Figure 5.
The inter-correlation between different immune cell subtypes in intratumoural and peritumoural regions of liver metastases. (a) The inter-correlation between each cell subtype number in intratumoural and peritumoural regions of liver metastases; (b) the inter-correlation of the CD8/CD3 ratio in the intratumoural and peritumoural regions of liver metastases; (c) the inter-correlation of the Foxp3/CD3 ratio in the intratumoural and peritumoural regions of liver metastases; and (d) the inter-correlation of the CD3/α-SMA ratio in the intratumoural and peritumoural regions of liver metastases. Pearson correlation coefficient (r) and significance levels (p value) are presented for each correlation. Data are presented as * p < 0.05, ** p < 0.01.

