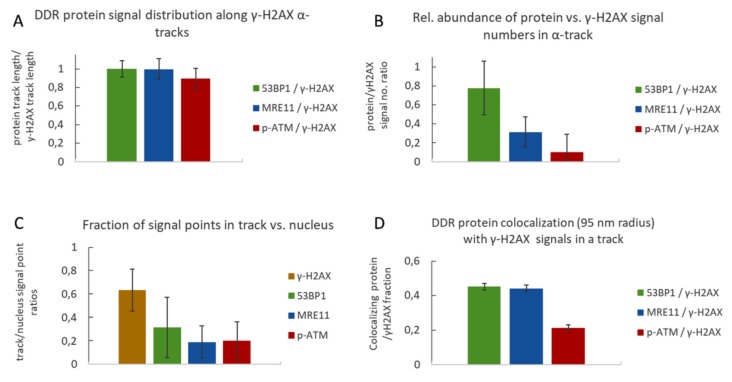
Figure 4.
Quantitative analysis of γ-H2AX and 53BP1, MRE11 and p-ATM signals in damage tracks. (A) Relative frequency distribution of the DNA damage response (DDR) proteins along alpha tracks. The extension of a track was defined as the distance of the farthest signal points along the axis in a damage track signal number histogram (e.g., Figure 2). It appears that the average track length computed for γ-H2AX, 53BP1, MRE11 and p-ATM signals is similar, indicating that protein signals are distributed over the full extension of the damaged chromatin along the alpha particle trajectory. (B) Average ratios of DDR protein signal numbers relative to γ-H2AX signal numbers per average alpha track. In all experiments, γ-H2AX signal points were most frequent, followed in decreasing order by 53BP1 > MRE11 > p-ATM. (C) Ratio of signal point number abundance for γ-H2AX, 53BP1, MRE11 and p-ATM inside the average γ-H2AX alpha-track relative to signals over the nucleus. The signal numbers for γ-H2AX in different co-staining experiments were similar; thus, all γ-H2AX data were pooled for further single-color analyses. The average ratios of signal points detected inside the respective γ-H2AX damage track mask versus signal points detected over the whole nucleus show that most γ-H2AX signals are concentrated inside the damage track, which is less so for 53BP1, MRE11 and p-ATM. (D) Fraction of DDR protein signal points co-localizing with γ-H2AX signal points within a defined radius of 95 nm. 45% of 53BP1 and MRE11 signals in a track co-localize with γ-H2AX signals in a 95 nm radius, while only 21% of p-ATM signals showed co-localization. Error bars represent standard deviation.

