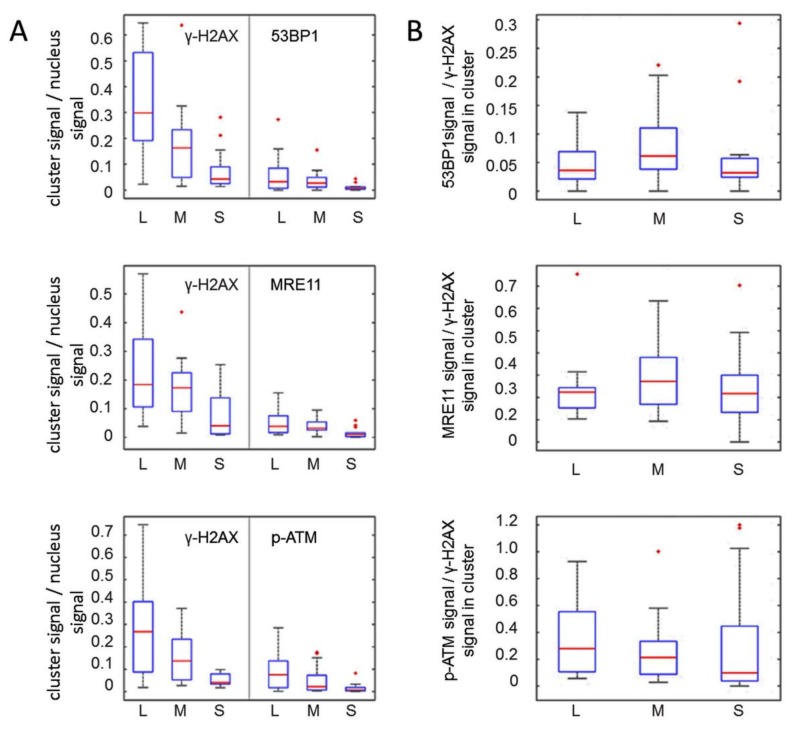
Figure 5.
Orientation of γ-H2AX damage tracks consisting of at least three differently sized super-foci. (A) Analysis of γ-H2AX damage tracks consisting of at least three separate super-foci of decreasing size (n = 53) oriented from largest (L), to medium (M), to smallest (S). The signal points inside each focus were normalized against the total measured signal numbers. In cases with more than one focus in between the largest and the smallest focus along the damage track (n = 11), the average signal points per cluster was calculated. The results are presented as boxplots for γ-H2AX together with the respective co-stained 53BP1, MRE11 and p-ATM protein tags. (B) Boxplot of the ratios of 53BP1, MRE11 and p-ATM signal numbers (top to bottom, respectively) against corresponding co-stained γ-H2AX signals in L, M and S foci as defined in (A). The relative γ-H2AX/protein signal ratios remain relatively constant for all cluster sizes.

