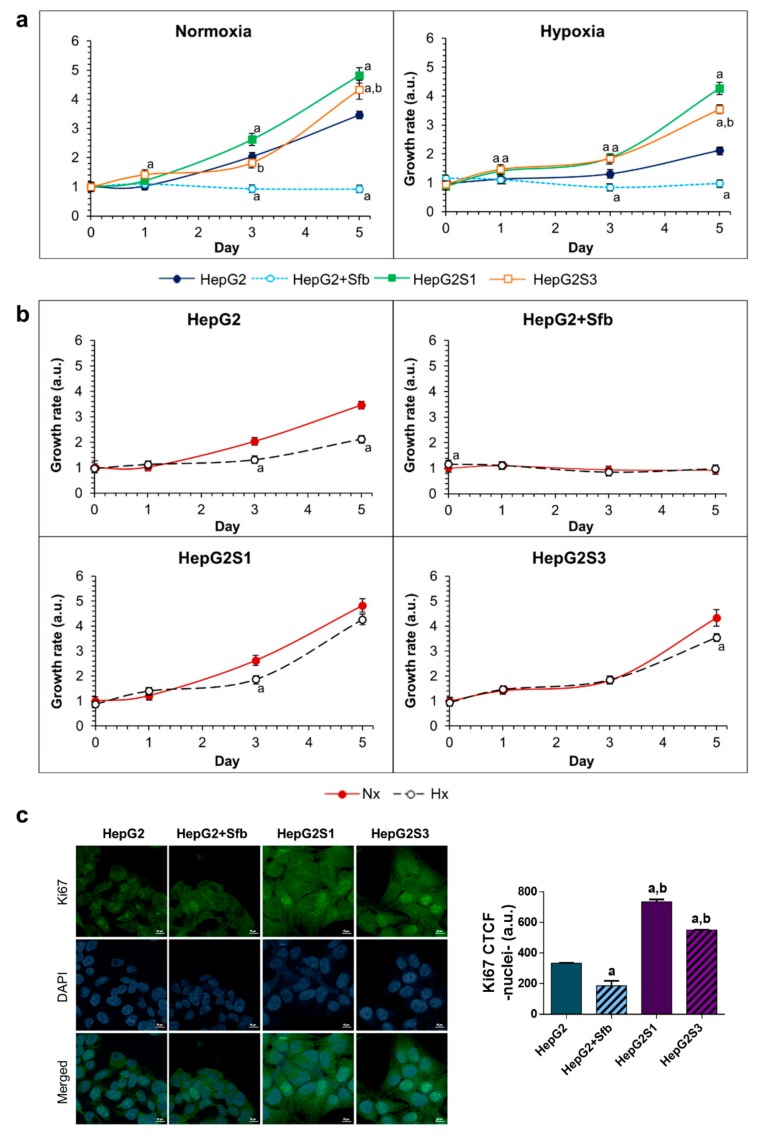
Figure 1.
Growth dynamics and cell proliferation: (a) Comparison of cell growth between HepG2S1 and HepG2S3 sorafenib resistant lines and HepG2 parental line under normoxia and hypoxia. a p < 0.05 vs. non-treated HepG2 cells, b p < 0.05 significant differences between sorafenib resistant cells; (b) Comparison of cell growth between normoxia and hypoxia within the same cell line. a p < 0.05 vs. normoxic cells; (c) Comparison of cell proliferation between resistant cell lines and HepG2 cells after 24 h incubation under hypoxia. Confocal images of Ki67 immunofluorescence staining (green) show Ki67 expression. 4′,6-diamidino-2-phenylindole (DAPI) staining (blue) denotes cell nucleus. Magnification: 63X, scale bar: 10 µm. a p < 0.05 and b p < 0.05 vs. non-treated and sorafenib-treated HepG2 cells, respectively. Data from (a–c) are expressed as mean values of arbitrary units (a.u.) ± SD of three independent experiments.

