Figure 2.
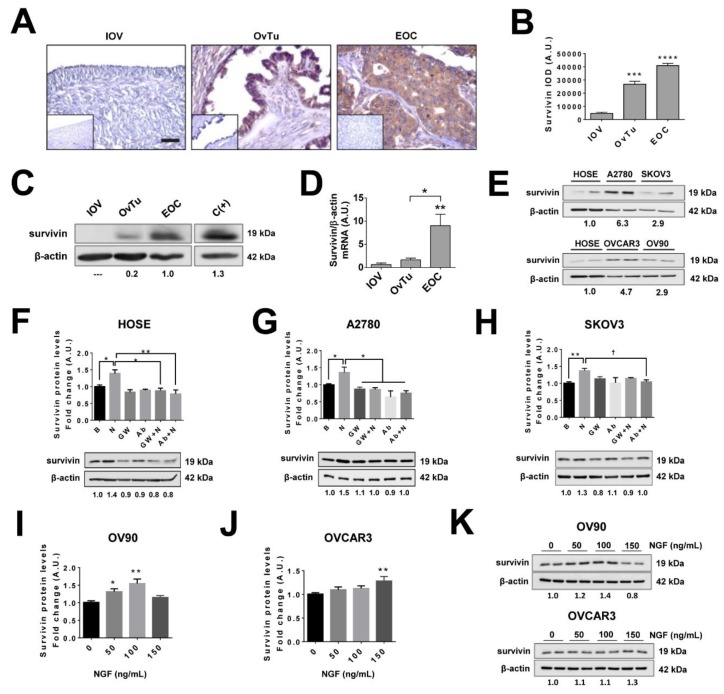
Survivin levels increase during EOC progression and following NGF stimulation of EOC cells. (A) Representative images of immunohistochemical detection of survivin in inactive ovarian epithelium (OVI, n = 5), epithelial ovarian tumors (OvTu; n = 6), and epithelial ovarian cancer (EOC, n = 12) tissue. Scale bar: 50 µm. (B) Semi-quantification of survivin immunodetection by immunohistochemistry. (C) Representative western blot of survivin protein levels in ovarian biopsies (with the survivin/β-actin ratios). (D) Quantification of survivin levels detected in extracts of ovarian tissues by western blotting, n = 4 for IOV, n = 11 for OvTu, and n = 15 for EOC. (E) Representative images of baseline levels of survivin evaluated by western blotting in ovarian cell lines (normalized to mean survivin/β-actin ratio). (F–H) survivin protein levels in ovarian cells lines either stimulated with NGF (N; 100 or 150 ng/mL as described in the methodology section), or treated with the neutralizing antibody against-NGF (Ab, 5 µg/mL) or the pharmacological TRKA inhibitor GW441756 (GW, 20 nM) for 2 h (HOSE and SKOV3 cells), 8 h (OV90 and OVCAR3), or 24 h (A2780 cells), respectively (with the survivin/β-actin ratio). n = 4 or more in duplicate per condition. (I–K) survivin protein levels following NGF stimulation in OV90 and OVCAR3 cells (normalized to average survivin/β-actin ratio). n = 4 or more in duplicate per condition. * = p < 0.05; ** = p < 0.01; *** = p < 0.001, and **** = p < 0.0001 with respect to baseline condition or as indicated (Kruskal–Wallis test and Dunn’s post-test). † = p < 0.05 as indicated (Mann–Whitney test). Results are expressed as the mean ± standard error of the mean (SEM).

