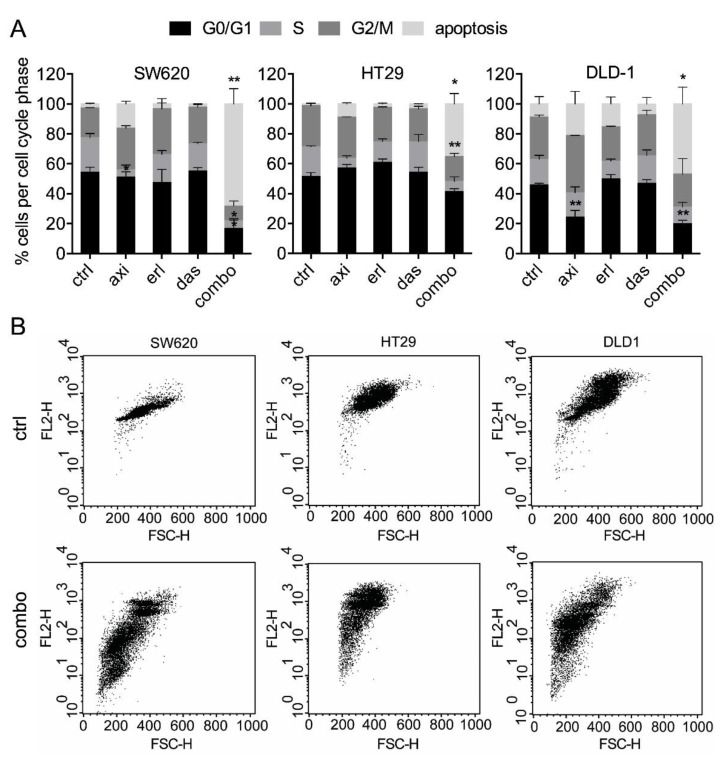
Figure 2.
SDC axitinib, erlotinib, and dasatinib significantly induces apoptosis. (A) DNA distribution of cell cycle phases by quantification of propidium-iodide staining of SW620, HT29, and DLD-1 cells. Cellular DNA content in permeabilized cells is proportional to fluorescence intensity (FL2-H; y-axis), and allows for the distinction of cells containing diploid DNA (G0/G1), tetraploid DNA (G2/M), and subdiploid DNA (apoptotic fraction). (B) Representative FL2-H/FSC-H plots of the non-treated and SDC-treated cells (combo). All values shown are presented as percentage of the control and represent the mean of at least two experiments performed in triplicates. Cells treated with 0.1% DMSO were used as a control (ctrl). Error bars indicate SEM. Significance (* p < 0.05, ** p < 0.01) is indicated as compared to the control.

