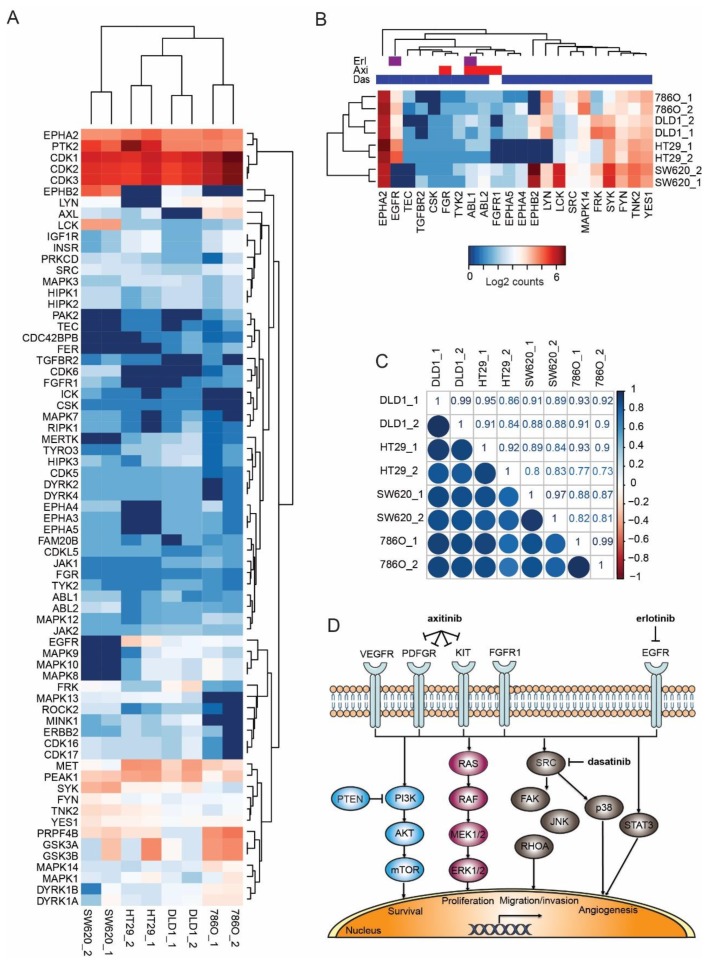
Figure 3.
Phosphokinase comparison of colorectal cancer (CRC) cell lines SW620, HT29, and DLD-1 with the renal cell carcinoma (RCC) cell line 786-O. (A) Phosphoproteomics analysis of the untreated cell lines was performed on pTyr immunoprecipitated tryptic protein digest. All detected phosphorylated protein kinases over a threshold of five summed normalized spectral counts were included. The heatmap shows log2 expression of counts and indicates comparable expression profiles among the CRC line and the RCC reference line 786-O. (B) Phosphorylated protein kinase drug targets of the combination that was used was similar as in (A). Note the absence of EGFR (erlotinib target) in SW620 and the absence of FGFR1 (axitinib target) in HT29. (C) Correlations of phosphorylated protein kinase expression in the 4 cell lines. (D) Schematic overview of drug targets and their downstream signaling pathways.

