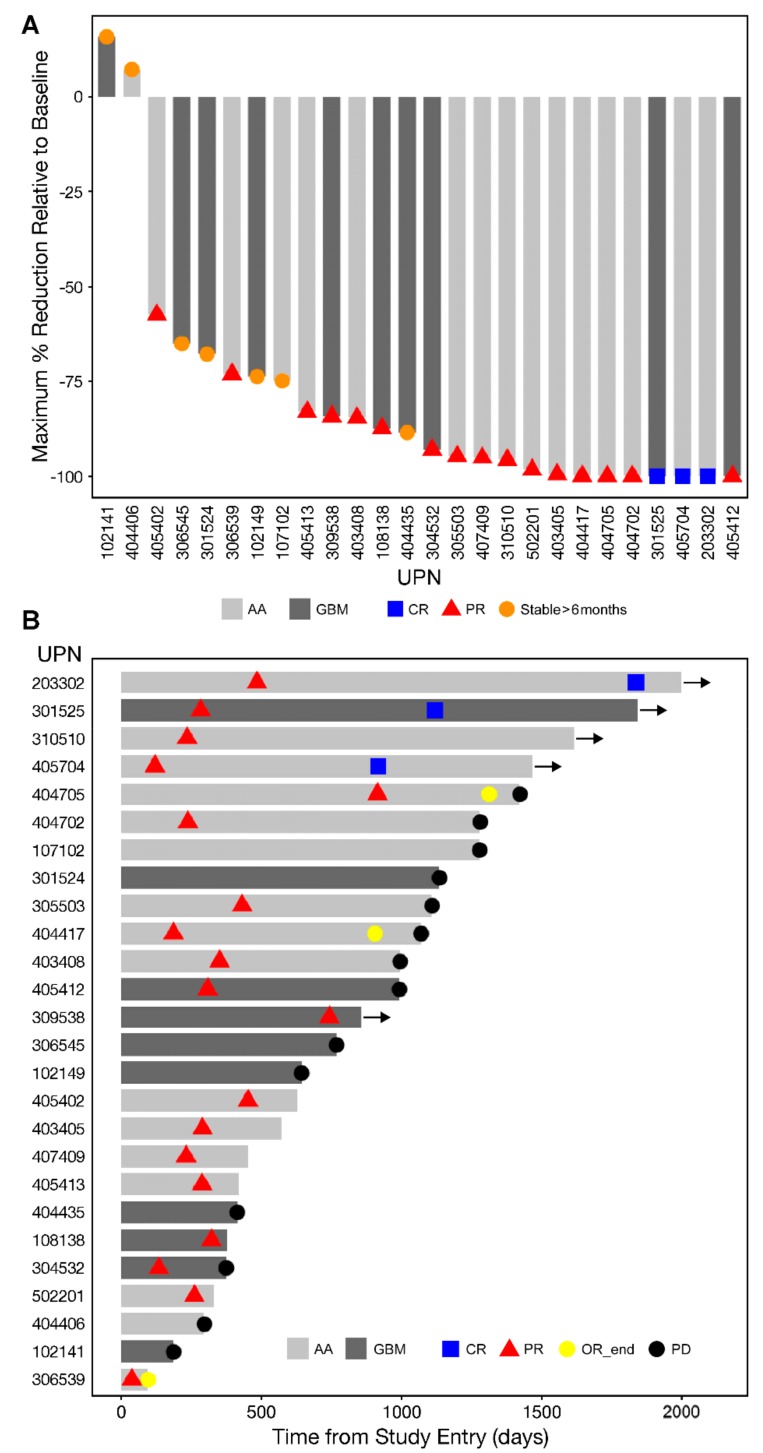
Figure 1.
(A) Waterfall plot of Maximum Tumor Reductions of the 26-patient Favorable Response Population: A waterfall plot is depicted to show the maximum tumor reduction relative to baseline (% reduction of the 3-D volume of the target lesion) in each of the 19 recurrent and/or refractory (R/R) high grade glioma patients who had a complete response (CR), partial response (PR) or stable disease lasting ≥6 months to OT101 single agent therapy. Vertical bars on these plots measured maximum reduction in tumor volumes of the treated target lesions following OT101 treatment. The best overall response (BOR) for each patient are indicated with specific symbols. (B) Swimmer Plot of Best Overall Responses of the 26-patient Favorable Response Population: The onset and duration of CR/PR, end of the objective response (OR) and onset of progression of disease (PD) are indicated with specific symbols. In patient 404705, the PD was an unconfirmed single point determination based on a follow-up MRI. In patient 3100510, the BOR determination was based on local review of the MRI data; the BOR was based on central review of MRI scans in others. See Table S9 for additional details.

