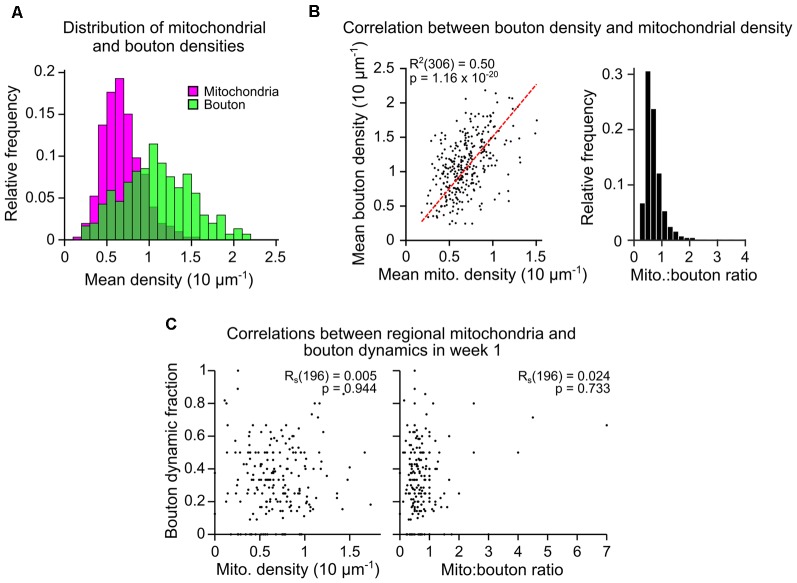
Figure 2.
Mitochondrial density along an axonal segment is correlated to bouton density but not bouton dynamics. (A) Mitochondrial and bouton density distributions for all axons (mean across time, n = 306 axons). (B) (left) Bouton and mitochondrial densities for each axon were strongly correlated (mean across time; R2 = Pearson’s correlation, n = 306). Red dashed line = linear regression. (right) Histogram showing the distribution of mitochondrion-to-bouton ratios for all axons (median = 0.65, approximately two mitochondria to every three boutons). (C) Example correlations between the fraction of boutons on each axon that were dynamic (lost or gained; bouton dynamic fraction) and either: (left) the number of mitochondria relative to the number of boutons (mito:bouton ratio), or (right) mitochondrial density. Results from the first weekly interval (between days 7 and 14) are shown (n = 196 axons over all weekly intervals, RS = Spearman’s rank correlation, see Supplementary Table S1).

