Figure 3.
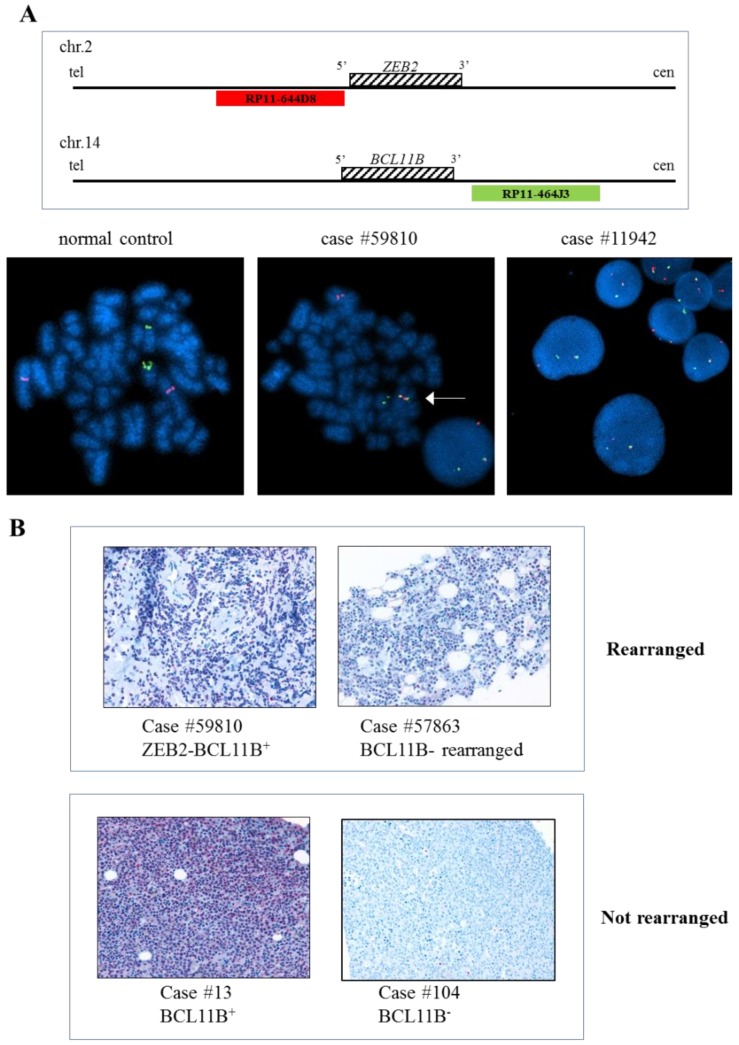
Immunohistochemistry and FISH of AML cases. (A) FISH analysis using specific probe for ZEB2 and BCL11B flanking regions. Schematic representation of RP11-644D8 BAC probe in Spectrum Orange covering the 5’ region of ZEB2 and RP11-464J3 BAC probe in Spectrum Green covering the 3’ region of BCL11B, is shown at the top. FISH performed on metaphase spread of case #59810 showing an abnormal fusion pattern (1 fusion, 1 orange and 1 green) with the fusion signal indicating ZEB2-BCL11B fusion gene on der(14) (bottom, central) and the same abnormal FISH pattern observed in interphase nuclei of case #11942 (bottom, right). A normal FISH pattern (2 red and 2 green signals) in a normal control case is shown (bottom, left). (B) Immunohistochemistry analysis of BCL11B-expressing AML samples #59810, #57863 and #13 carrying t(2;14)(q22.3;q32.3), t(7;14)(q21q32) and no 14q32 alteration, respectively. BCL11B expression was detected in samples regardless of the presence of the 14q32 alterations. The expression was limited to the nucleus and the percentage of positive neoplastic cells was always ≥ 50%.

