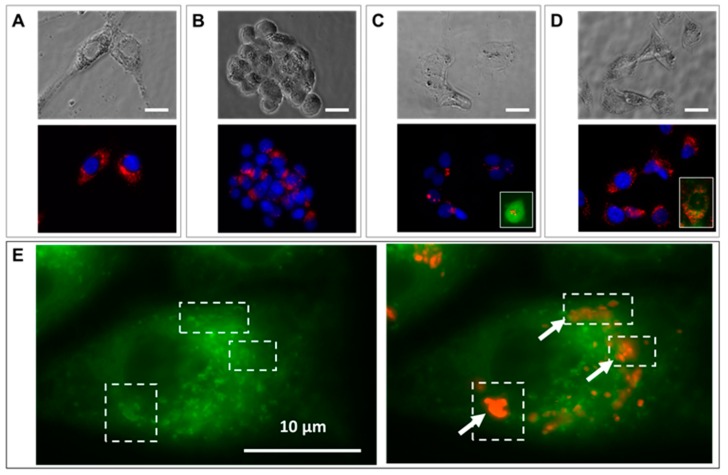
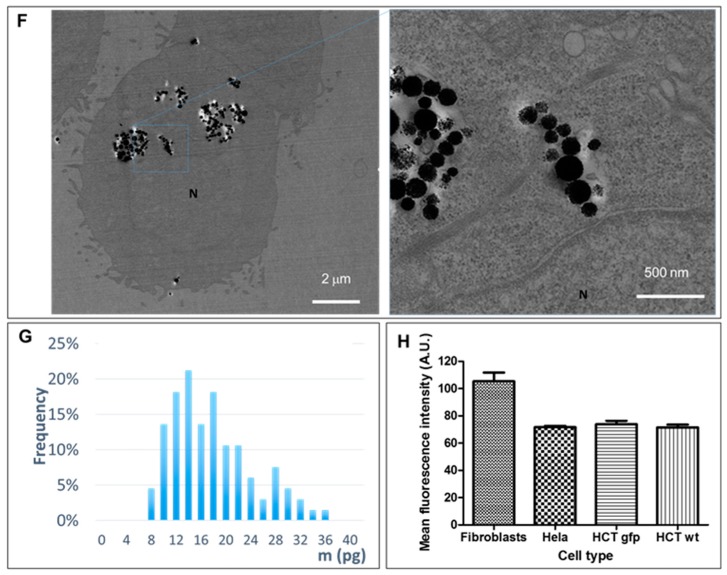
Figure 2.
Cellular uptake of RB-nanochains-COOH obtained at an extracellular iron concentration of 5 mM within the RPMI medium. (A–D) Bright field (top) and fluorescence (bottom) micrographs showing RB-nanochain-COOH-loaded cells (A) Normal dermal fibroblasts, (B) HCT-116 wild type cells, (C) HCT-116 GFP cells, and (D) HeLa GFP-Rab7 cells (Scale bar 20 µm, Mag. ×40. Cell nuclei are stained in blue—Hoechst 33342 fluorescent stain. Insets in (C,D) show the intrinsic green fluorescence of GFP-expressing cells). (E) Left: Green fluorescence micrograph of a HeLa GFP-Rab7 cell, exhibiting characteristic green fluorescing endosomes, and right: green and red fluorescence micrographs overlay showing the co-localization of green fluorescing endosomes (white dashed line squares) with red fluorescing RB-nanochains-COOH clusters (squares and arrows) (Mag. ×100), (F) Representative transmission electron micrograph showing a loaded HCT-116 wild type cell (left) and the magnified view of internalized chains (right). N denotes the cell’s nucleus. (G) Iron quantification in loaded HCT-116 wild type cells, as determined by single cell magnetophoresis. The graph shows the distribution of internalized iron (expressed in picograms of iron per cell) after cells incubation with 5 mM extracellular iron concentration. (H) RB-nanochains-COOH internalization in different cell types expressed as mean fluorescence intensity determined in a population of 500 cells. The error bars represent the SD of mean fluorescence intensities determined from 6 experiments per cell type.


