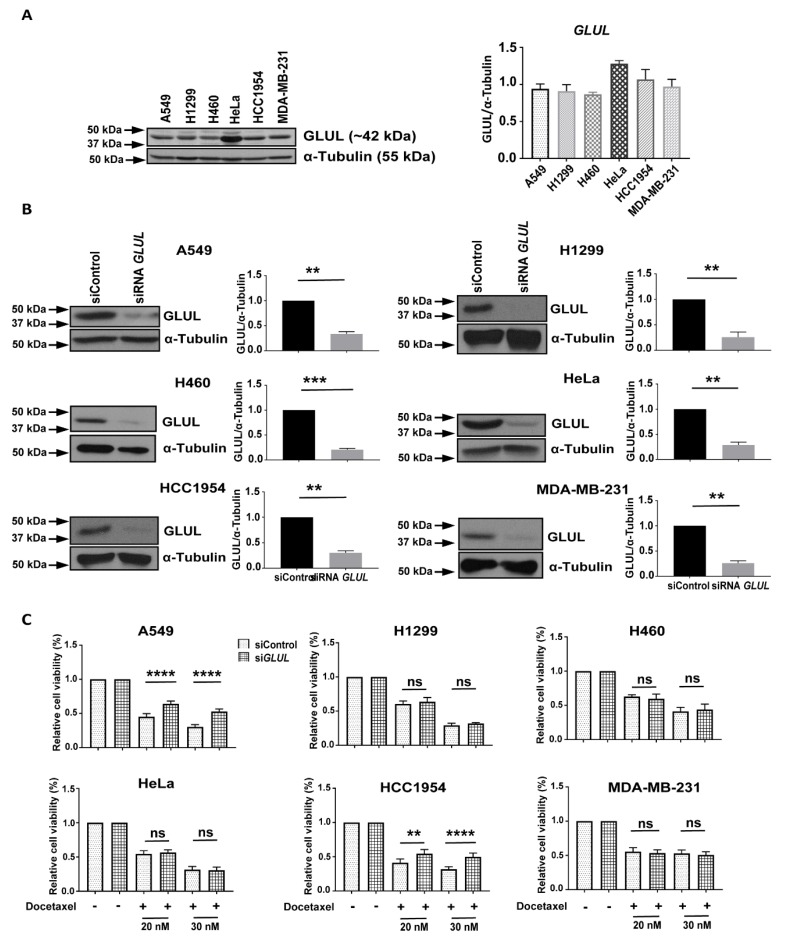
Figure 1.
Reduced GLUL expression induced drug resistance. (A) GLUL (glutamate-ammonia ligase) protein expression was analyzed in different cancer cell lines. (B) Cell lines were either transfected with scrambled (siControl) or with siRNA GLUL as noted, and levels of GLUL protein expression were analyzed by western blotting. The western blot membranes were subsequently probed with an anti-tubulin antibody to assess equal loading. The presence of GLUL and tubulin protein is indicated on the right side of each blot. The approximate location of various molecular weight markers is indicated on the left side of each blot. kDa, kilo Dalton. (C) GLUL knockdown cell lines were treated with 20 and 30 nM of docetaxel for 72 h, and the cell viability was quantified by MTS assay. The standard error (SE) bars in cell viability graphs represent means of three independent experiments. The data are shown as mean ± SEM; p-values were determined using a two-tailed unpaired t-test; **** p ≤ 0.0001; ** p ≤ 0.002; ns—not significant.

