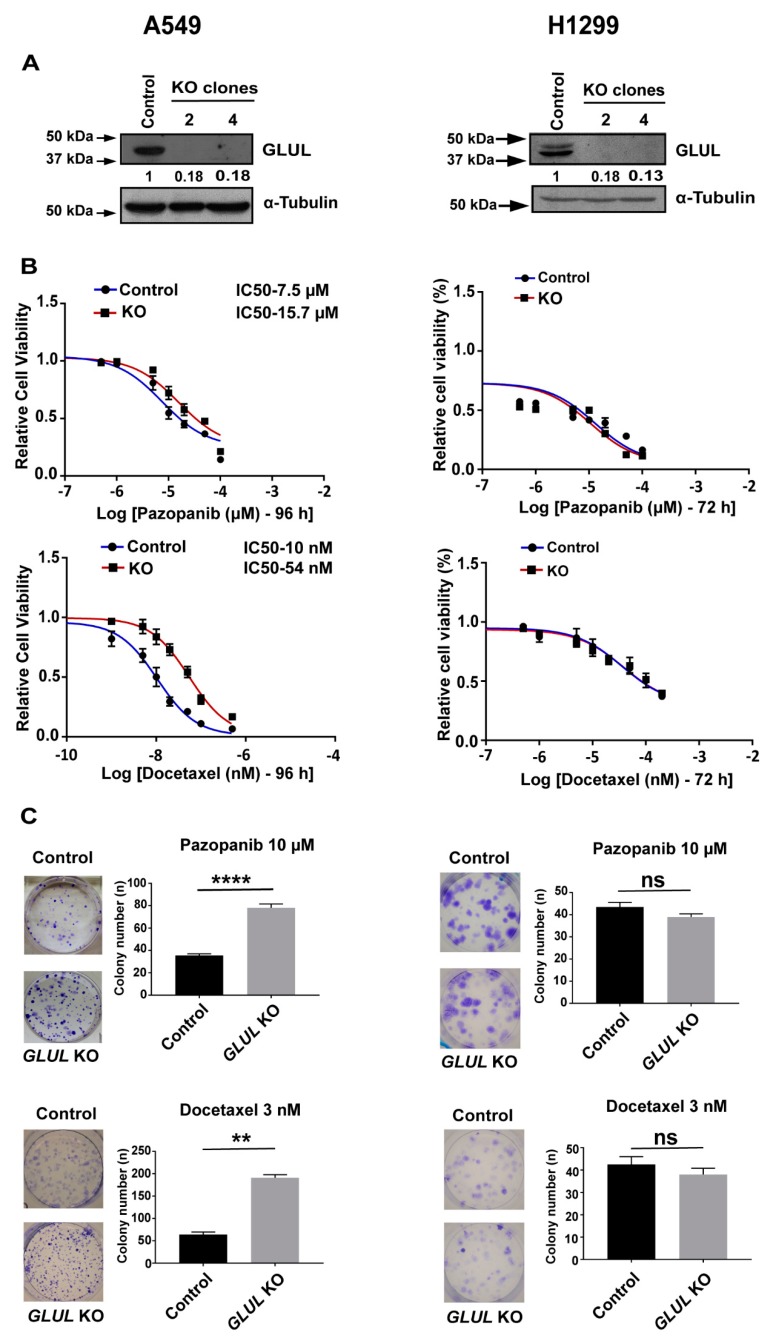
Figure 2.
CRISPR/Cas9-mediated GLUL KO (knockout) conferred drug resistance in A549 but not in H1299 (A) A549 and H1299 cells were transfected with either negative controls (Lentiviral-empty vector) or Lentiviral CRISPR/Cas9-GLUL guide RNAs. Subsequently, cell lysates were analyzed by western blot (WB, see Methods) for GLUL expression, and individual clones devoid of GLUL expression were selected. The western blot membranes were subsequently probed with an anti-tubulin antibody to assess equal loading. The presence of GLUL and tubulin proteins are indicated on the right side of each blot. The signals for the GLUL and α-tubulin proteins were quantified by densitometry, and the numbers below GLUL blots indicate levels of GLUL protein in each lane following normalization of the signals with tubulin levels. For comparison, the signal intensity of GLUL in the control lane was assigned an arbitrary value of 1. The approximate location of various molecular weight markers is indicated on the left side of each blot. kDa, kilo Dalton. (B) A549 and H1299 control (DMSO-treated) or GLUL KO cells were treated with the indicated chemotherapeutic drugs, and the cell viability was analyzed by MTS assay after 72–96 h. IC50 for each drug was determined as indicated. (C) A549 and H1299 control and GLUL KO cells were treated with the indicated drugs and subjected to clonogenic assay. Histograms represent a total number of colonies counted, and the representative images of crystal violet stained cells are shown. The standard error (SE) bars in cell viability assay and clonogenic assay represent the means of three independent experiments. The data are shown as mean ± SEM; p-values were determined using a two-tailed unpaired t-test; **** p ≤ 0.0001; ** p ≤ 0.004, * p ≤ 0.01, ns—not significant.

