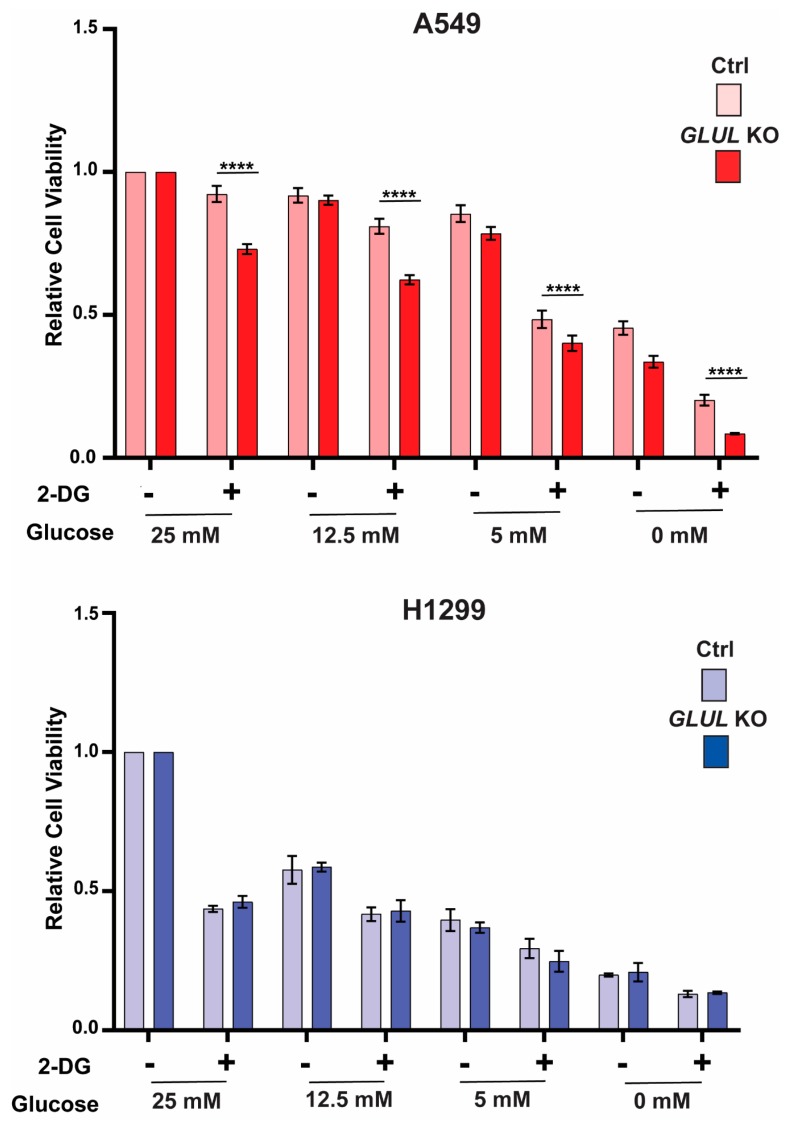
Figure 4.
A549 GLUL KO cells displayed sensitivity to glucose deprivation. A549 and H1299 (control and GLUL KO) cells were cultured in various concentrations of glucose as indicated and were treated with 5 mM of 2-DG for 72 h, and the cell viability was analyzed by MTS assay. Data for each pair of cell lines (control/GLUL KO) was normalized to the data for the highest concentration of glucose (25 mM), as shown above. The data are shown as ± standard deviation. The standard deviation (SD) bars in the cell viability graph represent the means of three independent experiments. The data are shown as mean ± SD; p-values were determined using a two-way ANOVA; **** p ≤ 0.001.

