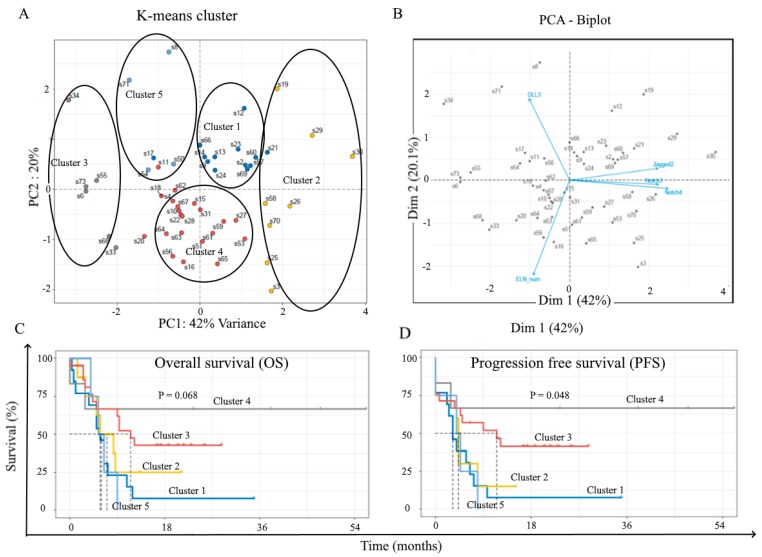
Figure 6.
Multivariate data analysis according to ELN groups, Notch3, Notch 4, Jagged 2, and DLL-3 expression levels. Thanks to R software, dimensionality reduction was performed through K-Means Clustering (A) and principal component analysis (PCA) (B). Log-rank (Mantel–Cox) analysis was used for establishing the difference in overall survival (OS) (C) and progression-free survival (PFS) (D) between the two groups.

