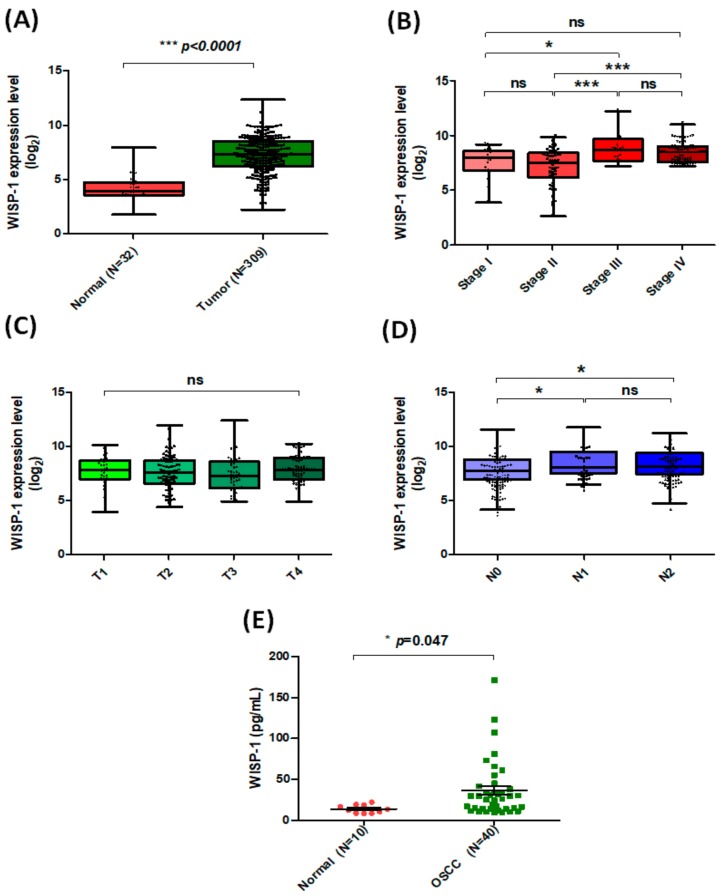
Figure 1.
Levels of WISP-l expression correlate with clinicopathologic features of oral cancer. (A) WISP-1 mRNA expression in tumor tissue and adjacent normal tissue was analyzed using records from The Cancer Genome Atlas (TCGA) database. Median levels (ranges) of WISP-1 expression in normal and tumor tissue samples: 4.168 (1.794–7.998) and 7.286 (2.257–12.416), respectively; log2(fold-change): 3.118. (B–D) Analyses of the TCGA records revealed the following median levels (ranges) of WISP-1 expression according to disease classification: stage I, 7.688 (4.013–9.373); stage II, 7.225 (2.756–10.037); stage III, 9.036 (7.367–12.416); stage IV, 8.622 (7.352–11.203); log2(fold-change): stage I vs. stage III: 1.348; stage II vs. stage III: 1.811; stage II vs. stage IV: 1.397; according to tumor status (median levels (range) of WISP-1 in T1–T4: T1: 7.778 (4.013–10.174); T2: 7.631 (4.464–11.978); T3: 7.499 (4.995–12.416); T4: 7.957 (4.973–10.275)) and according to regional lymph nodes (median levels (ranges) of WISP-1 in N0-N2: N0: 7.267 (3.621–11.007); N1: 7.985 (5.927–11.203); N2: 7.842 (4.196–10.674); log2(fold-change): N0 vs. N1: 0.718, N0 vs. N2: 0.575). (E) The ELISA assay was used to measure WISP-1 levels in serum specimens. Results are expressed as the mean ± SEM. * p < 0.05, ** p < 0.01, *** p < 0.005, NS p > 0.05 compared with the control group.

