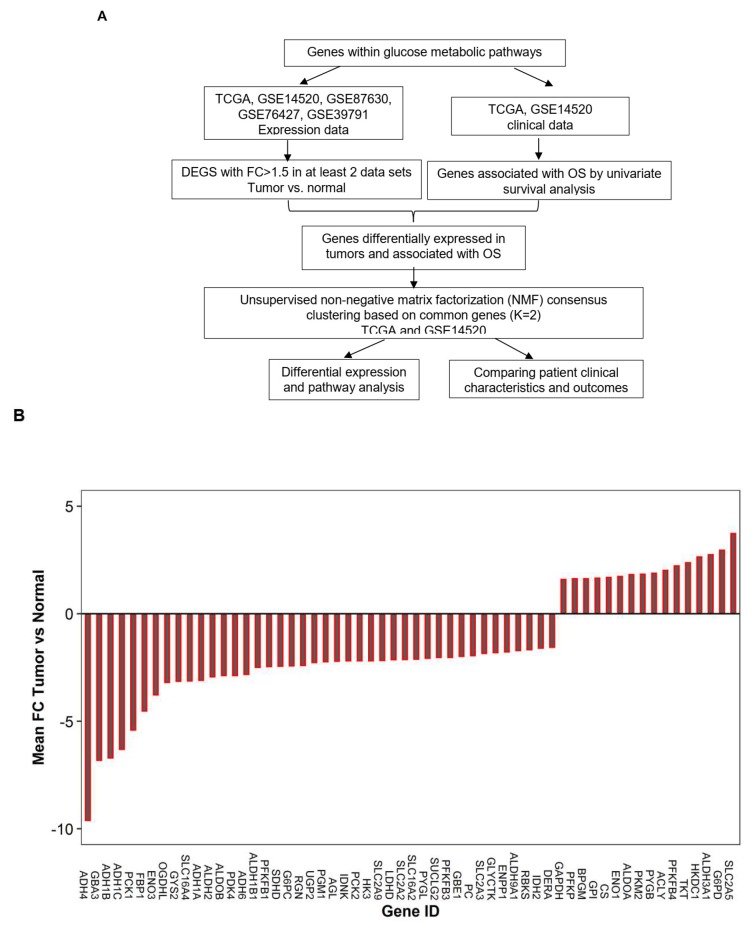
Figure 1.
Outline of the planned work for this study (A) and waterfall plot showing the deregulated genes within the glucose metabolic pathway in Hepatocellular carcinoma (HCC) (B). The gene expression was first compared between the tumor and the normal cells as described in the methods (FC ≥ 1.5 and p < 0.0056), and then the genes that were significantly differentially expressed in at least two of the five data sets were chosen. The fold change on the Y-axis was the mean fold change of the gene expression comparing the tumor to the normal cells averaged across the number of data sets in which it showed a differential expression. OS: overall survival. FC: Fold change.

