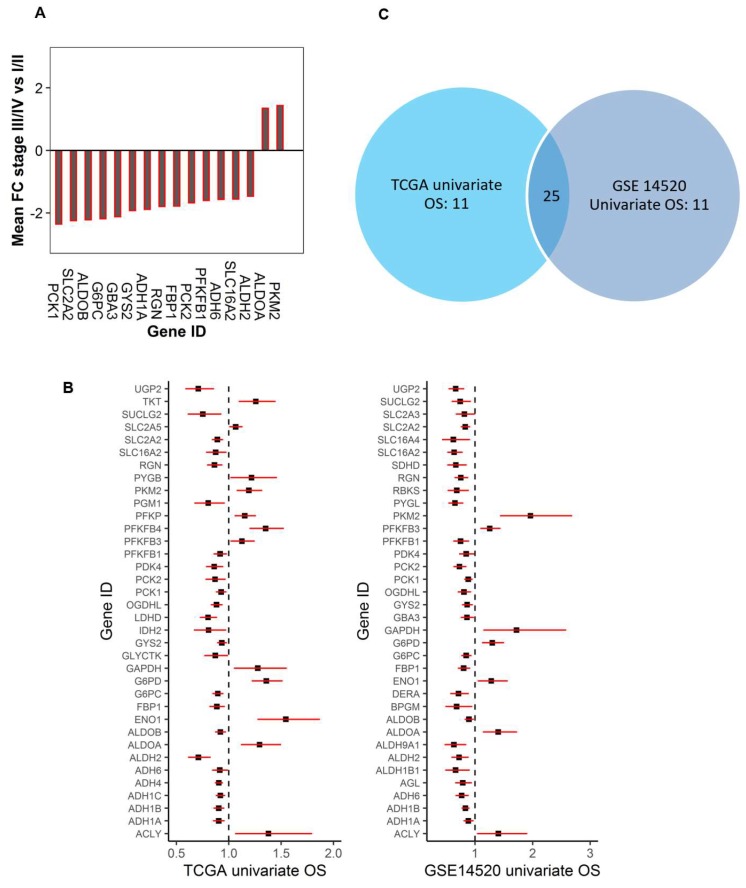
Figure 2.
Dysregulated genes within the glucose metabolic pathway associated with the AJCC (American Joint Committee on Cancer) tumor stage and the OS of HCC patients. (A). The waterfall plot to show the differentially expressed genes in the tumor were also associated with an aggressive stage of the tumor (p < 0.0001). The down-regulated genes were further down-regulated, and the up-regulated genes were further up-regulated in late stage tumors. (B). The association of glucose metabolic gene expression with patients’ overall survival in HCC (Left: TCGA, and right: GSE14520) (p < 0.05). The forest plots with the hazard ratios (HR) and 95% confidence intervals (CI) showing a survival advantage (HR < 1) or disadvantage (HR > 1) with increased expression of the dysregulated glucose metabolic genes. Univariate Cox proportional hazard regression models were used for the association tests. (C). The Venn diagram to show the number of genes that were specific or common for the two data sets based on univariate OS analysis in Fig2B.

