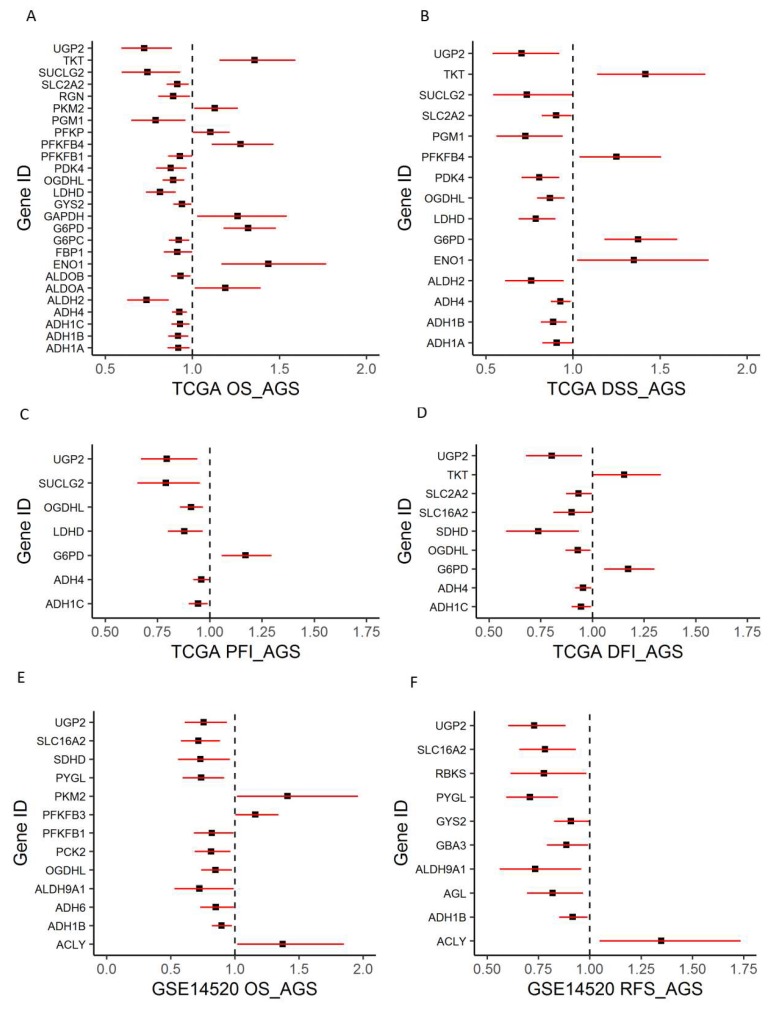
Figure 3.
Forest plots to show an association between glucose metabolic gene expression and patient survival outcomes. (A–D). Overall survival (OS), disease-specific survival (DSS), disease-free interval (DFI), and progression-free interval (PFI) for TCGA data. (E–F) OS and recurrence-free survival (RFS) for GSE14520 data. Multivariate Cox proportional regression models were used for testing while controlling for age, gender, and the tumor stage (AGS) in the model besides gene expression (p < 0.05).

