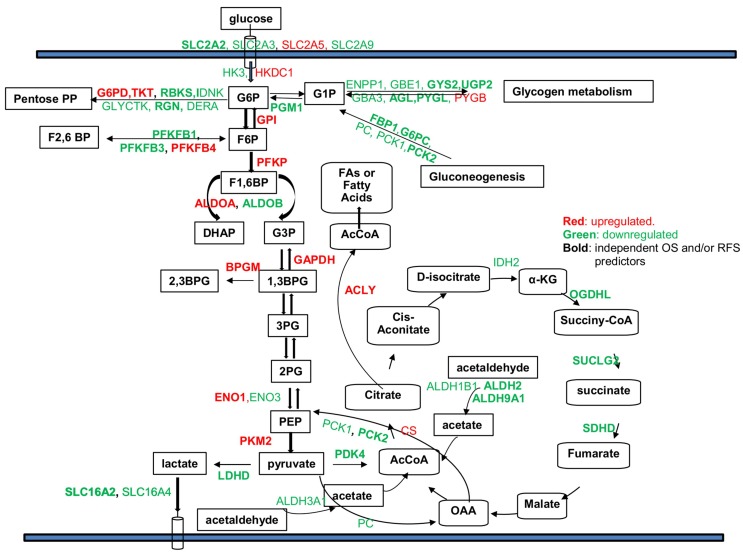
Figure 4.
Summary of deregulated genes within different glucose metabolism related pathways and the potential use of certain genes as independent predictors for OS and /or RFS. Red: genes significantly up-regulated in tumors. Green: genes significantly down-regulated in tumors compared to normal tissues. Bold: genes that could be used as independent predictors for OS and /or RFS after controlling for age, gender, and tumor stage in the multivariate Cox regression model (p-values < 0.05). ADH1A, ADH1B, and ADH6 were all down-regulated in HCC tumors in all five data sets, but they were not labeled in the graph since their specific function in glucose metabolic pathways is not clear.

