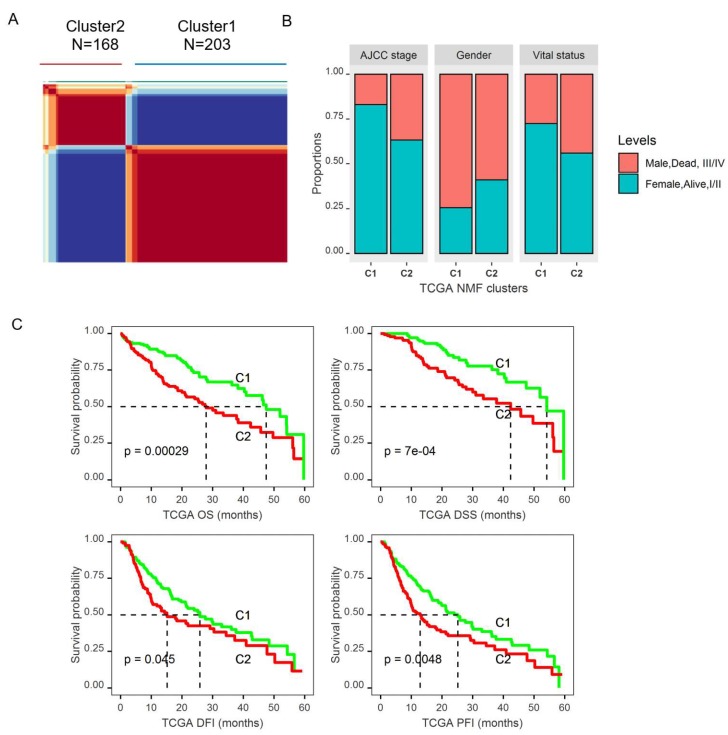
Figure 5.
Identification of molecular subtypes of HCC using TCGA data based on the DEGS in the tumor that were also associated with OS from the univariate analysis. (A). The non-negative factorization (NMF) consensus plot for TCGA identified two distinct HCC subtypes: Cluster1 and Cluster2. (B). Histogram showing that Cluster2 (C2) patients had a higher proportion of female patients, more patients with a late stage tumor, and more death events compared to Cluster1(C1). (C). Log-rank tests showed that Cluster2 patients had significantly worse five-year OS, DSS, DFI, and PFI (p < 0.05).

