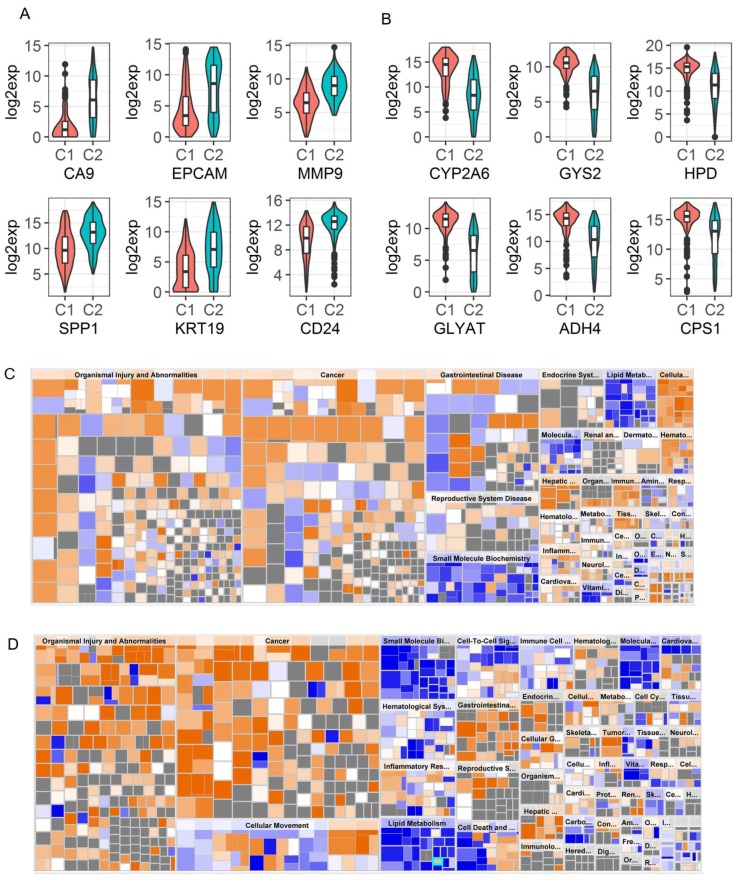
Figure 7.
Top differentially expressed genes between the two NMF clusters and Pathway analysis based on the DEGs for TCGA and GSE14520, respectively. (A) and (B). violin plots to show top up-regulated stemness related genes and top down-regulated metabolic genes, respectively, in Cluster2 (C2) compared to Cluster1 (C1) patients using TCGA data. (C) and (D). Heatmaps to show the diseases and functions that were affected in Cluster2 compared to Cluster1 based on IPA analysis using the differentially expressed genes between the 2 NMF clusters for TCGA and GSE14520 data, respectively. Orange squares stand for pathways involved in specific diseases and/or functions that were activated and blue squares stand for those that were down-regulated in Cluster2 compared to Cluster1.

