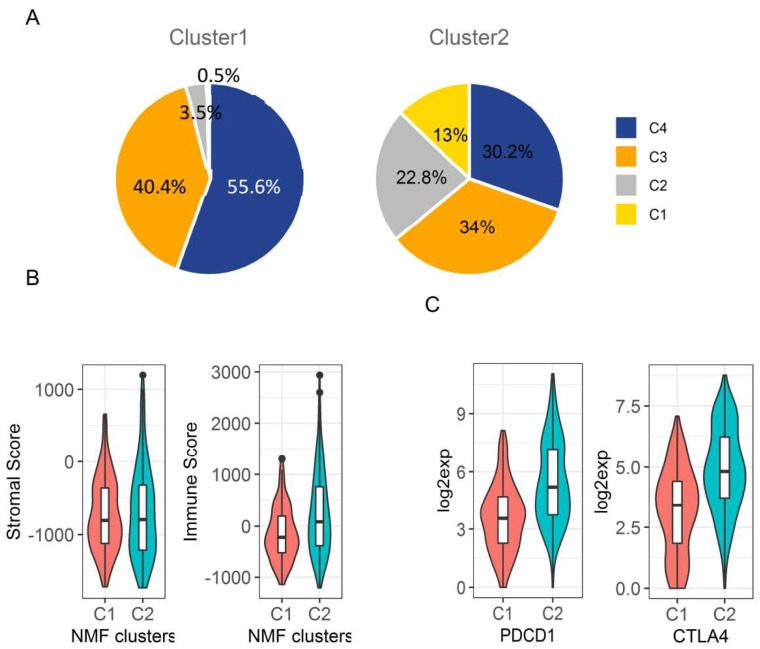
Figure 8.
Comparison of the tumor microenvironment between the two NMF clusters using TCGA data. (A). Pie charts to show that Cluster2 had significantly higher proportion of patients belonging to immune subtypes 1 and 2 that were associated with worse survival, but had a lower proportion of patients belonging to immune subtypes 3 and 4 that had better survival (p < 0.0001). (B). Cluster2 tumors had significantly higher immune cell infiltration as measured by the immune score than Cluster1 tumors (p < 0.0001), but not the level of stromal cells as measured by the stromal score (p > 0.05). (C). Cluster2 tumors had significantly higher PD1 (PDCD1) and CTLA-4 expression than Cluster1 tumors (p < 0.0001). Note: C1–C4 in (A) indicates immune subtypes, while C1 and C2 in (B) and (C) indicates Cluster1 and Cluster2.

