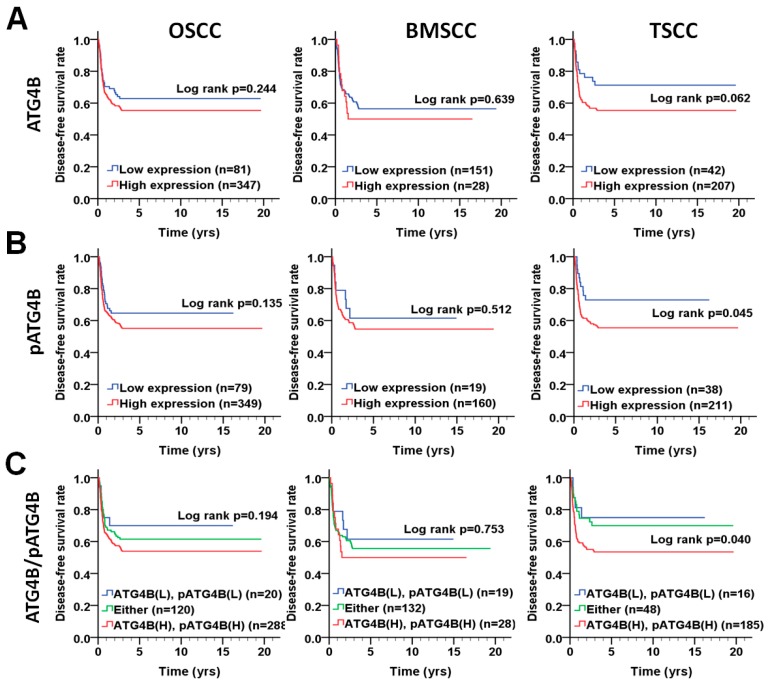
Figure 4.
DFS survival curves for ATG4B and phospho-Ser383/392-ATG4B expression in patients with BMSCC or TSCC. (A) DFS survival curves in relation to ATG4B or (B) phospho-Ser383/392-ATG4B (pATG4B) expression are shown for OSCC (left panel), BMSCC (middle), and TSCC (right panel) patients. (C) DFS survival curves for the coexpression of ATG4B and phospho-Ser383/392-ATG4B are shown for OSCC, BMSCC, and TSCC patients. The cutoff values for high or low protein levels of ATG4B and phospho-Ser383/392-ATG4B in tumor tissues were based on the ROC curve.

