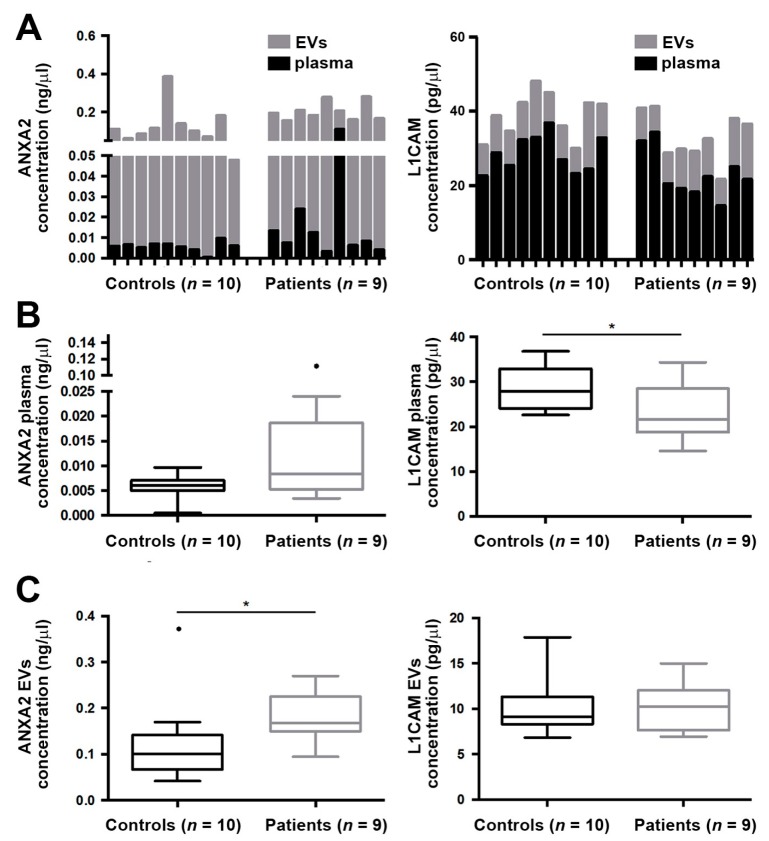
Figure 3.
ANXA2 and L1CAM levels in endometrial cancer (EC) plasma samples and circulating EVs from patients and healthy controls. (A) Analysis of ANXA2 and L1CAM levels in plasma showed that ANXA2 levels mainly corresponded to purified EVs while L1CAM levels were mainly present in the soluble fraction of plasma. (B) Analysis of both markers in complete plasma samples from healthy controls and patients showed higher levels of L1CAM in controls and no significant differences for ANXA2 levels (* p = 0.027 and p = 0.090, respectively, according to Mann–Whitney U test). (C) Analysis of ANXA2 levels in circulating EVs showed significantly increased levels in patients vs. healthy controls (* p = 0.027, according to Mann–Whitney U test) while L1CAM did not show differences (p = 0.887, according to Mann–Whitney U test). These comparative analyses were conducted with 9 patients and 10 healthy controls included in the global cohort of patients and healthy controls (see Table 1).

