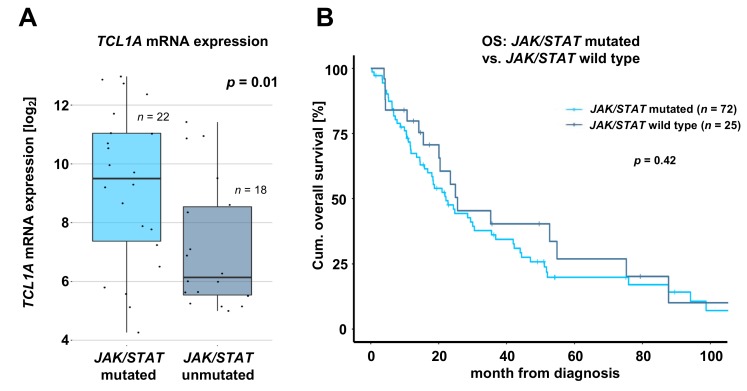
Figure 3.
JAK/STAT mutation status shows association with elevated TCL1A mRNA expression, but not with patient outcomes. (A) TCL1A mRNA expression measured by array-based gene expression profiling (GEP) of JAK/STAT mutated cases compared to cases without any JAK or STAT mutation (fold change: 4.1; p = 0.01, Student’s t-test). (B) Overall survival (OS) of JAK/STAT mutated cases (median OS: 21.0 months) compared to cases without any JAK or STAT mutation (median OS: 25.5 months, p = 0.42, log rank test). Significant associations between mutations affecting JAK3 or STAT5B with immunophenotypic, mutational, and expression data are displayed in Figure S1. Associations of mutations affecting JAK1, JAK3, or STAT5B with OS are presented in Figure S2.

