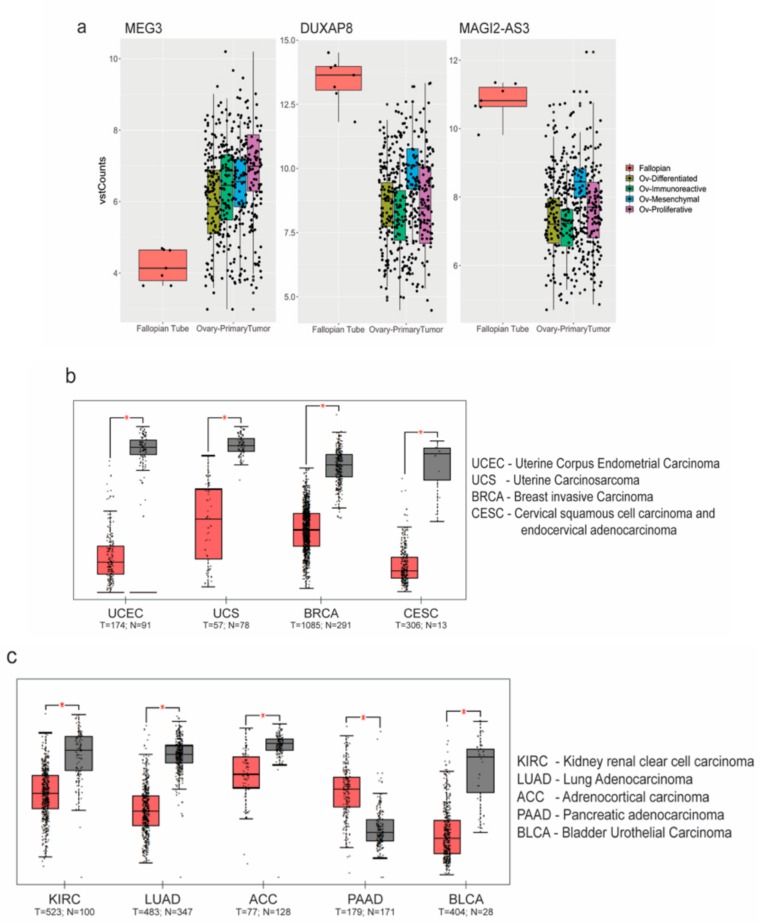
Figure 2.
Analysis of non coding RNA (ncRNA) expression: (a) MEG3, DUXAP8 and MAGI2-AS3 ncRNAs plotted as box plots between High Grade Serous Ovarian Carcinoma (HGSC) subtypes and Fallopian Tube (FT) tissues obtained from The Cancer Genome Atlas - Ovarian Cancer (TCGA-OV) and Genotype Tissue Expression (GTEx-FT); Expression of MAGI2-AS3 in (b) gynecological; and (c) other obtained from TCGA using Gene Expression Profiling Interactive Analysis (GEPIA) (between tumor (red) and normal (grey) tissue).

