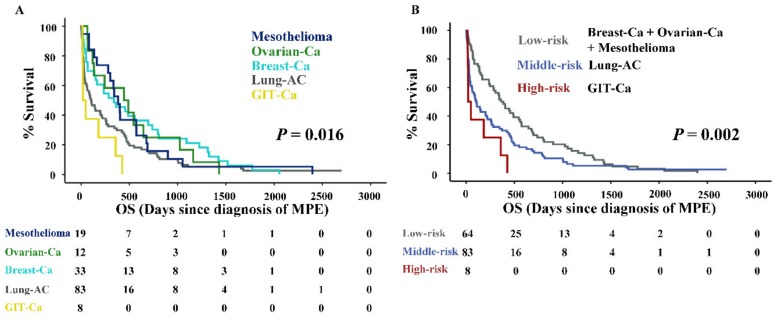
Figure 1.
Overall survival of malignant pleural effusion (MPE) patients. (A) Kaplan–Meier curves of MPE patients according to the five tumor entities. (B) Kaplan–Meier curves of MPE patients according to the three risk categories. p-value of log rank test is indicated. Abbreviations: Overall survival (OS).

